

Axis Bank posted standalone profit after tax of ₹7,003 Cr for Q2 FY27, up 38% year on year. The stock then had its biggest single-day fall in three months. This Axis Bank share price analysis looks at why. Loan growth and lower credit costs carried the quarter, while net interest margin (NIM) slipped to 3.36%. Verdict: StockPrompt.ai’s model is bullish at 72/100, but the margin story is not yet proven.
Q2 FY27 results: profit jumped, but lower provisions did part of the work
The headline profit is strong, but it is partly flattered by lower provisions. Standalone PAT was ₹7,003 Cr, up 38% year on year but down 2% from ₹7,114 Cr in Q1. Provisions fell about 50% year on year.
Core operating profit gives a steadier picture. It rose 11% year on year to ₹10,998 Cr, though it was about 1% lower than in Q1. For more on how we read bank results, see our quarterly results guide.
| Metric (Q2 FY27) | Value |
|---|---|
| Net interest income (NII) | ₹15,371 Cr (+12% YoY, +5% QoQ) |
| Core operating profit | ₹10,998 Cr (+11% YoY) |
| Standalone PAT | ₹7,003 Cr (+38% YoY) |
| Cost-to-assets | 2.14% (−24 bps YoY) |
| GNPA / NNPA | 1.16% / 0.35% |
| Net credit cost | 0.45% |
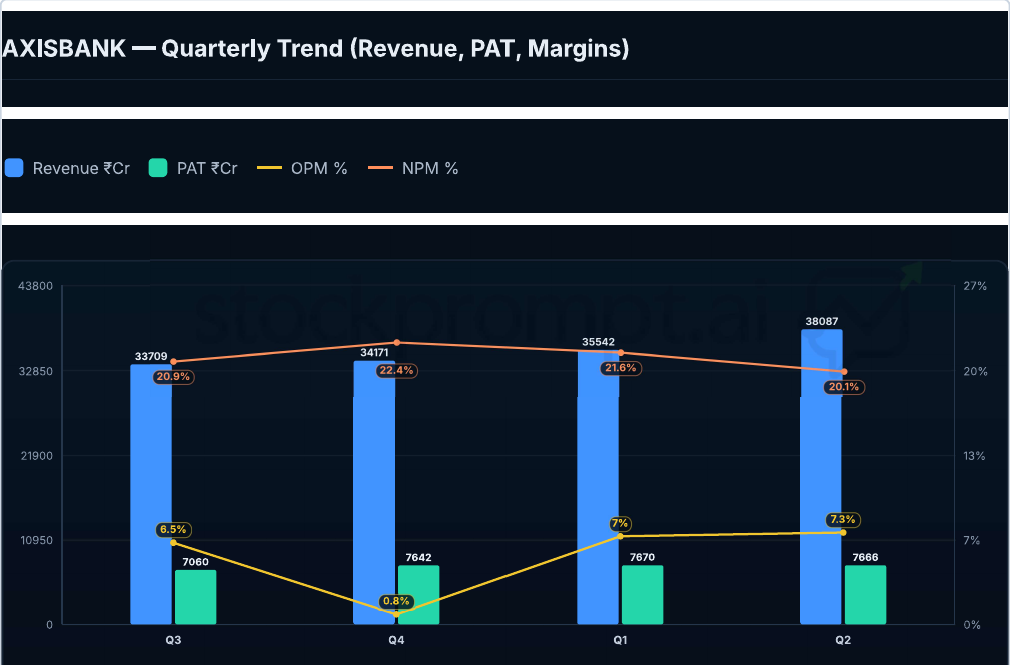
Chart 1: Axis Bank quarterly trend (revenue, PAT, OPM, NPM)
The financial database shows quarterly net profit of ₹7,642 Cr (Mar 2026), ₹7,670 Cr (Jun 2026) and ₹7,666 Cr (Sep 2026), which is broadly flat. These database figures differ from the bank-reported standalone PAT above.
Growth drivers: loan growth of 23% is doing the heavy lifting
Advances grew 23% year on year to ₹13,73,727 Cr, ahead of deposits at 21% (₹14,52,066 Cr). Management says it can grow at “industry plus 300 bps” over the medium term. In its Q1 FY27 commentary it reported gaining roughly 10 bps of loan market share and 20 bps of deposit market share year on year.
- Mix shift: small business banking, SME and mid-corporate loans are ₹3,316 bn, or 24% of loans, up about 772 bps in five years. These segments usually carry higher yields.
- Credit costs: net credit cost of 0.45% is down 28 bps year on year.
- Liquidity: FCNR(B) deposits of ₹1,018 bn were raised. Deploying them is the near-term growth and margin lever.
- Capital: CET-1 is 14.61% and CAR is 16.27%, with about 49 bps of additional cushion from other provisions and a one-time standard-asset provision of ₹8,006 Cr.
- Subsidiaries: Axis Finance earned H1 FY27 PAT of ₹546 Cr (+42%). Subsidiaries add about 50 bps to consolidated ROE, which was 14.23% annualised for H1 FY27, up 170 bps.
Scale supports all of this, with 6,275 domestic branches (Mar 2026) and about 55 mn customers.
The biggest weakness: margins and deposit mix
NIM is the one number moving the wrong way. It slipped to 3.36% in Q2 FY27 from 3.46% in Q1, or 3.47% excluding the FCNR(B) impact. Management has kept its 3.8% structural NIM goal but has given no near-term NIM outlook.
The deposit mix is the main reason. Average CASA has fallen, and a high loan-to-deposit ratio leaves little room to fund growth cheaply. The model rates margin risk as high.
| Metric | Latest | Earlier |
|---|---|---|
| NIM | 3.36% (Q2 FY27) | 3.46% (Q1 FY27) |
| Average CASA ratio | 37.8% (Mar 2026) | 43.6% (Mar 2023) |
| Loan-to-deposit ratio | 94.6% | – |
If NIM recovers toward 3.8%, it would be an upside lever on top of growth. It is not the driver today.
Valuation vs peers: a discount to the leaders, not to every bank
At ₹1,336.10 (11 Nov 2026 close), Axis Bank trades at 13.87x P/E and 1.68x P/B. The model’s verdict is “fairly valued”, not cheap.
| Bank | P/E |
|---|---|
| Axis Bank | 13.87x |
| HDFC Bank | 15.62x |
| ICICI Bank | 19.15x |
| Kotak Mahindra Bank | 22.86x |
Against the industry, Axis is in line on P/E (13.4x) and at a modest premium on P/BV (1.30x). On the wider six-peer chart below, the median P/E is 12.8x, so Axis sits about 8% above it.
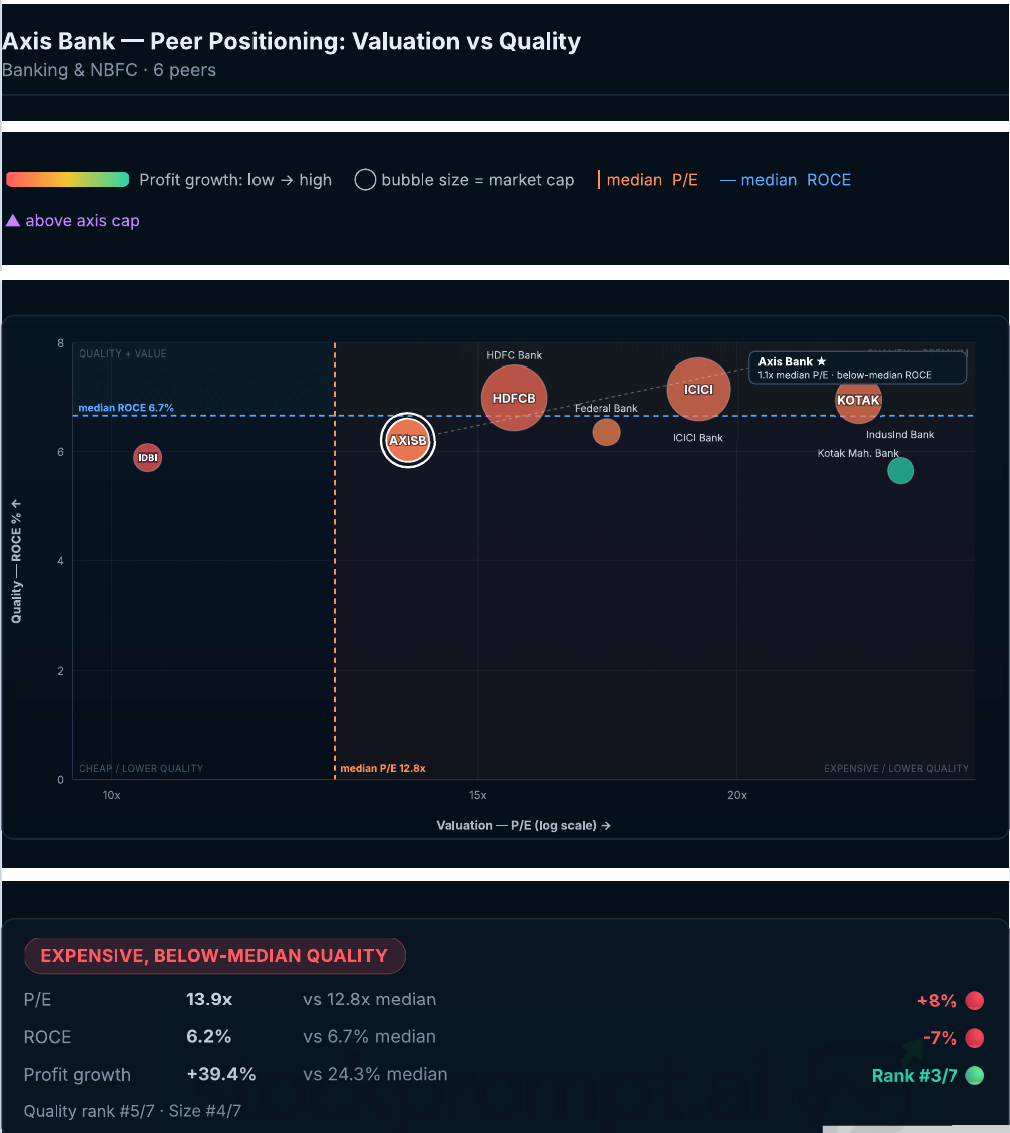
Chart 2: Peer positioning, valuation vs quality
A re-rating toward ICICI Bank or HDFC Bank would need visible, sustained NIM recovery and ROE above 14%. The base-case model level implies about 14.48x trailing EPS of ₹96.32. You can run the same peer comparison on any NSE stock with StockPrompt.ai’s features.
Technical view and model levels: strong trend, stretched in the short term
Price is above both key averages, but momentum is near the top of its range. The stock is about 7% above its 50-DMA and about 4% above its 200-DMA, and MACD is bullish. RSI is about 68–69 and Bollinger %B is 93.1, near the ₹1,348.97 upper band.
The 52-week range is ₹1,161.30–₹1,403, so the price is 5.0% below its high. ADX of 22.54 reads as ranging, and the chart panel labels the trend “mixed”.
Model levels for education (medium-term, about 63 trading days):
| Level | Price | Distance from ₹1,336.10 |
|---|---|---|
| Favourable zone | ₹1,300.78–₹1,324.33 | – |
| Base-case model level | ₹1,394.96 | +4.40% |
| Bull-case model level | ₹1,424.40 | +6.61% |
| Risk level | ₹1,247.80 | −6.61% |
| Bear-case level | ₹1,262.52 | −5.51% |
The reward-to-risk ratio is 0.67x on the base case at the current price. It improves to 1.27x near the favourable zone. Fibonacci 23.6% sits at ₹1,345.96, with ₹1,310.67 and ₹1,282.15 below it, and Parabolic SAR is bullish at ₹1,222.04.
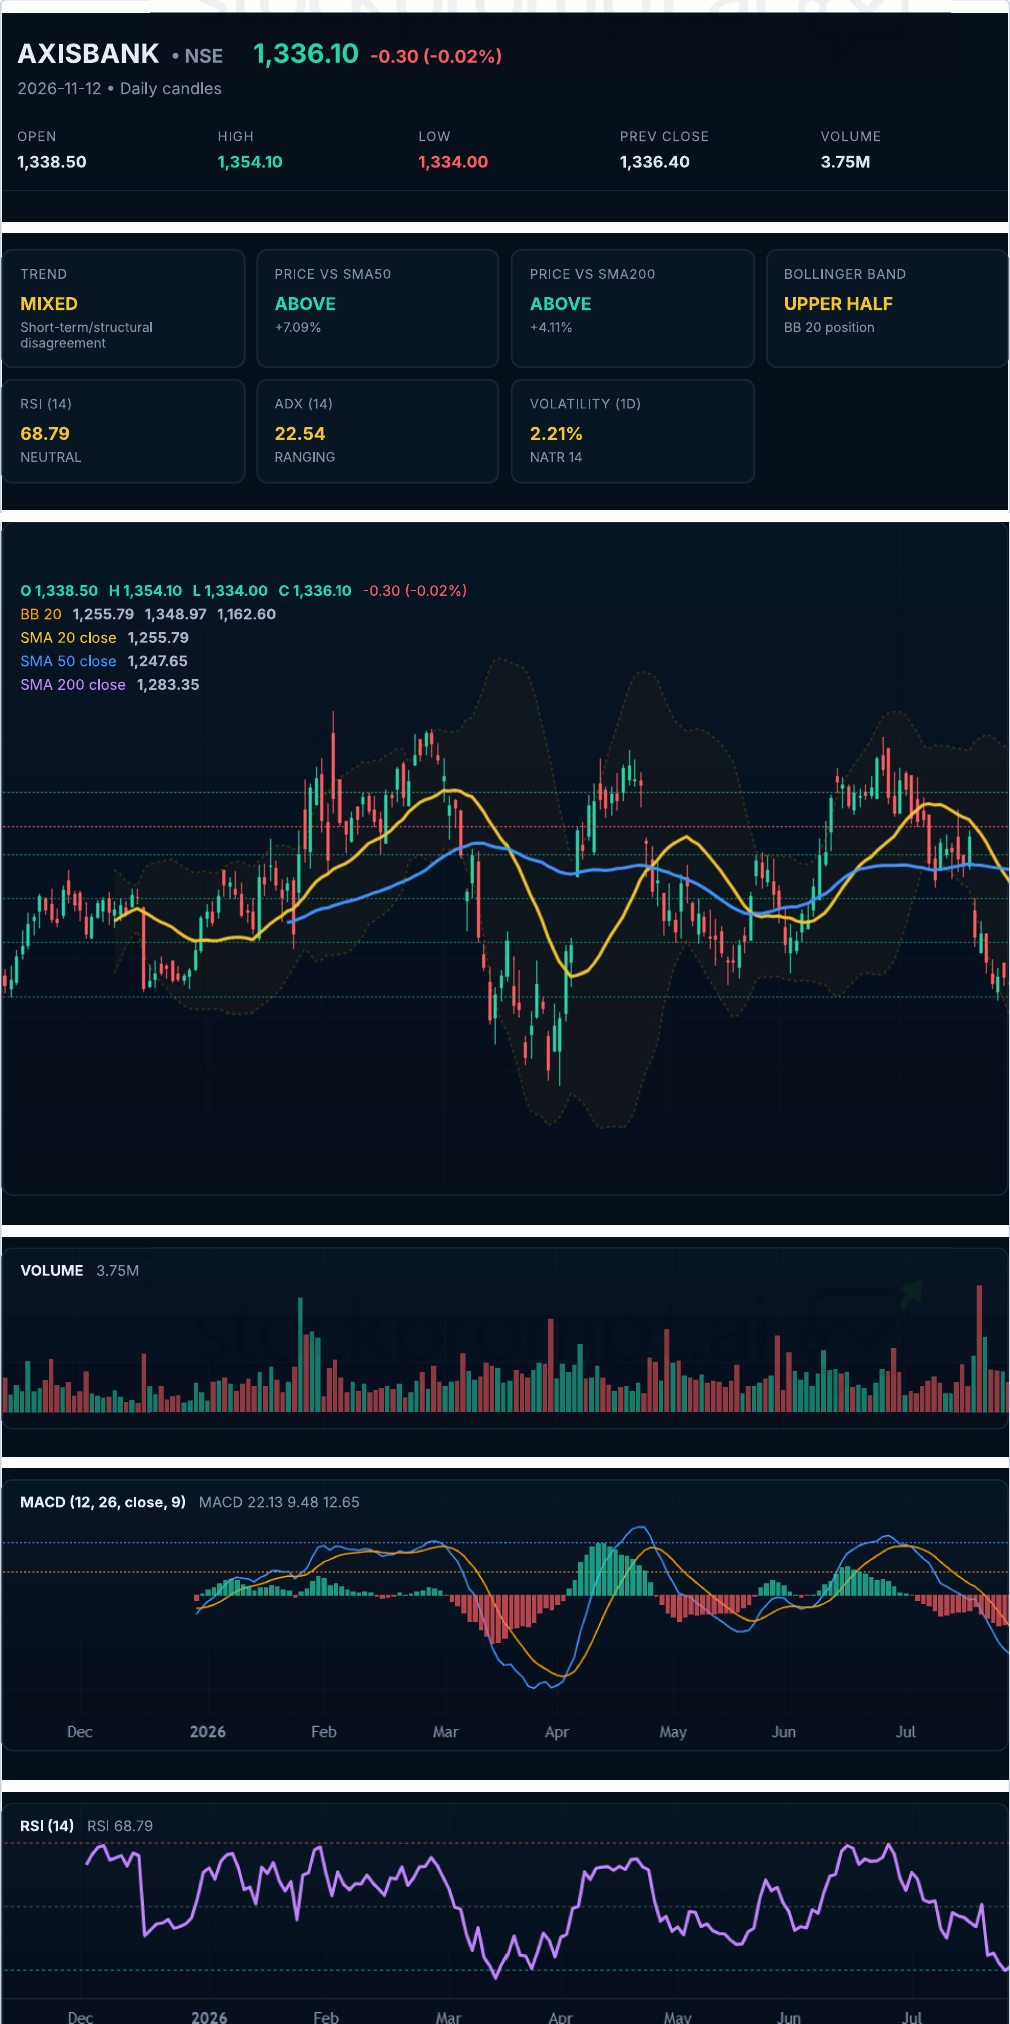
Chart 3: AXISBANK price with moving averages, Bollinger Bands, volume, MACD and RSI
Risks and what to watch
The model rates margin risk as high and most other risks as moderate or low.
- Margin (high): NIM is 3.36% and there is no near-term outlook from management.
- Funding mix (moderate): falling CASA and a high loan-to-deposit ratio raise the cost of funds.
- Quality of earnings (moderate): the year-on-year PAT jump leans on lower provisions.
- Technical stretch (moderate): RSI and %B raise the odds of a pullback.
- Regulatory (low): SEBI issued a censure against subsidiary Axis Capital on 30 Oct 2026. There was no recorded investor harm, and the bank expects no material impact.
Ownership is a mixed signal. FIIs trimmed their stake by 1.86 pp to 38.05%, while DIIs added 1.85 pp to 44.54%. Promoter holding is 7.86% with 0% pledged.
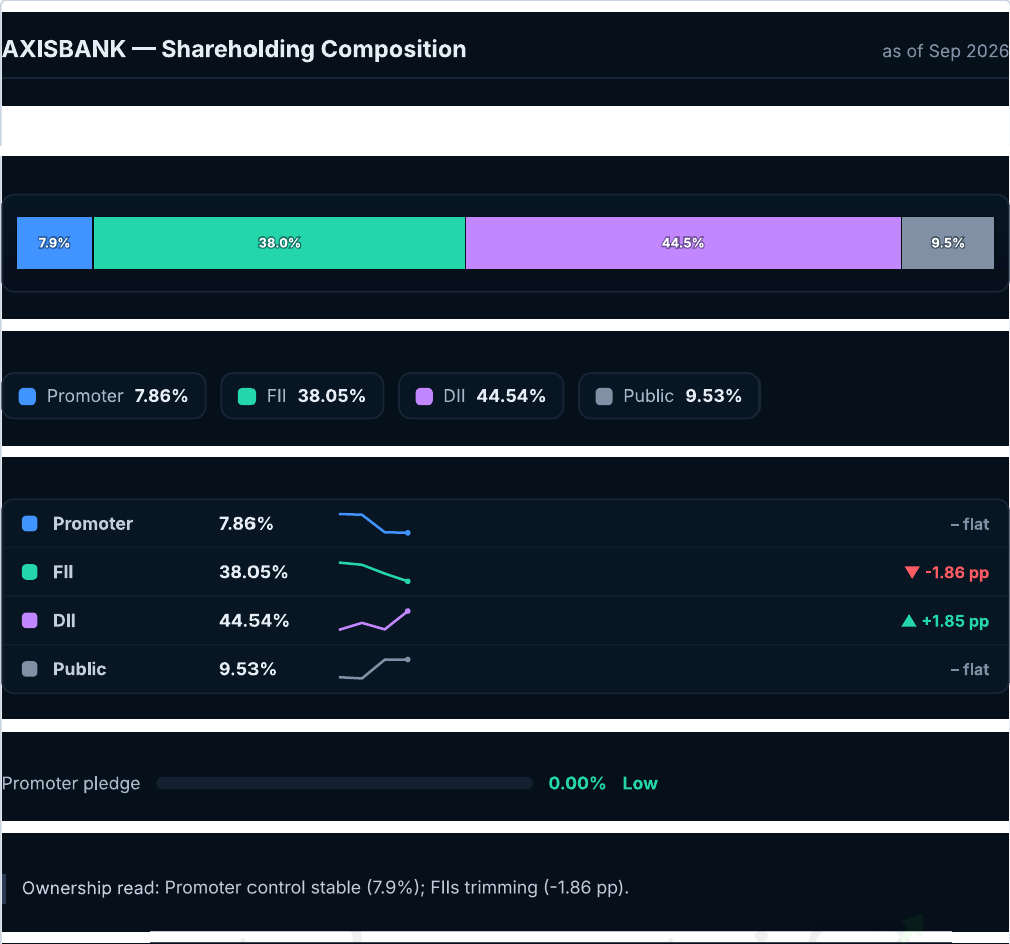
Chart 4: Shareholding composition, Sep 2026
Six things to watch:
- NIM progress toward 3.8%, and whether FCNR(B) deposits are deployed profitably.
- CASA ratio and cost of deposits.
- Loan-to-deposit ratio against loan growth.
- Credit cost and slippages.
- Core operating profit growth against provision-aided PAT growth.
- FII flows.
Conclusion: the next leg depends on the margin line, not the loan book
Axis Bank has shown it can grow loans at 23% with credit costs falling. The open question is whether that growth turns into better margins. Until NIM and CASA stabilise, the market may keep reading strong profit with caution.
If you want to track that question quarter by quarter, try StockPrompt.ai free and run the same analysis on any NSE or BSE stock. Plans are listed on our pricing page.
Try This on StockPrompt.ai
Axis Bank Stock Analysis 2026: Can Improving Margins Unlock Its Next Growth Phase?
Frequently Asked Questions
Is Axis Bank’s NIM improving?
Not yet. NIM was 3.36% in Q2 FY27 (3.47% excluding the FCNR(B) impact), down from 3.46% in Q1. Management retains a 3.8% structural goal but has given no near-term outlook.
How does Axis Bank’s P/E compare with HDFC Bank, ICICI Bank and Kotak?
Axis Bank trades at 13.87x P/E, below HDFC Bank (15.62x), ICICI Bank (19.15x) and Kotak (22.86x). It is in line with the industry P/E of 13.4x.
What are the model levels for Axis Bank for education?
The model’s favourable zone is ₹1,300.78–₹1,324.33. Its base-case level is ₹1,394.96 and its risk level is ₹1,247.80. These are model levels for education, not investment advice.
Disclaimer: This is AI-generated analysis for educational purposes only. AI can make mistakes, so verify all data independently. It is not SEBI-registered investment advice. Please consult a SEBI-registered advisor before making investment decisions.
Sources: Company filings, Q2 FY27 press release and investor presentation (17 Oct 2026), Q1 FY27 earnings call transcript (18 Jul 2026), exchange announcements, market news reports and publicly available peer financials.