

HDFC Bank’s shares have rebounded about 21% from the ₹669.20 low of late October to ₹808.55, yet Q2 FY27 standalone profit grew only 4.7%. This HDFC Bank stock analysis 2026 asks whether loan growth and margins can justify the move. Our model scores the stock 73/100 and labels it “Bullish (Moderate)”. The verdict: the story is improving, but with the stock overbought, profit growth now has to catch up with the price.
Q2 FY27 Results: Advances Up, Profit Barely Moves
HDFC Bank’s balance sheet is growing faster than its earnings. Gross advances rose 16.3% year on year (YoY) and advances under management rose 15.3%, while net interest income (NII) grew 9.7% and standalone profit only 4.7%. Excluding treasury gains, standalone profit grew about 12.6%, so lower treasury income explains part of the gap. The shares fell about 6% after the results, which were in line with expectations, before recovering.
| Metric (Q2 FY27) | Value | YoY |
|---|---|---|
| Net interest income | ₹34,620 Cr | +9.7% |
| Standalone profit after tax (PAT) | ₹19,510 Cr | +4.7% |
| Gross advances | ₹32.2 lakh Cr | +16.3% |
| Deposits | ₹33.27 lakh Cr | +18.8% |
Consolidated PAT was ₹20,700 Cr, taking H1 FY27 to ₹39,940 Cr. Note that about 4 percentage points of deposit growth came from a special FCNR(B) window, so underlying deposit growth is lower than the headline. For a method to read results like these, see our guide to analysing quarterly results using AI.
What Is Driving Loan Growth at HDFC Bank
Lending is broadening beyond one segment. SME and mid-market loans grew 23.5% YoY, up from the 17–18% of recent quarters, and retail advances grew about 11.7%. Retail disbursements crossed ₹90,000 Cr in Q2, against ₹76,000 Cr in Q1, and new credit cards reached 1.4 million, up about 19% on the previous quarter.
The backdrop helps. System credit growth rose to 14.1% in FY26, led by retail and MSME loans, and management describes the credit environment as benign. Asset quality agrees: gross NPA is 1.11% (0.87% excluding agriculture), 13 basis points lower than a year ago, with credit cost at 0.44%.
The franchise strengths are intact too:
- Scale: 101 million customers, 9,689 branches, 14.0% of system advances and 12.4% of deposits.
- Returns: ROA of 1.78% in Q2 and core cost-to-income of 39.1%.
- Fee mix: retail makes up 92% of fee income, which is granular and stable.
- Liquidity: a liquidity coverage ratio of about 113%, against a 100% minimum.
The Margin and CASA Problem
The weak link is margins. Net interest margin (NIM) was 3.16% on total assets and 3.32% on earning assets in Q2 FY27, down from 3.3% and 3.4% a year earlier. Yield on assets slipped from 7.8% to 7.6%, while cost of funds eased from 4.6% to 4.4%, so cheaper funding is only offsetting lower yields, not widening the spread.
The deposit mix explains much of the squeeze. The CASA ratio (low-cost current and savings deposits) was 31.6% in September 2026, against 33.9% a year ago and 44.0% in March 2023. Term deposits grew 22.8%, which pushes funding costs up.
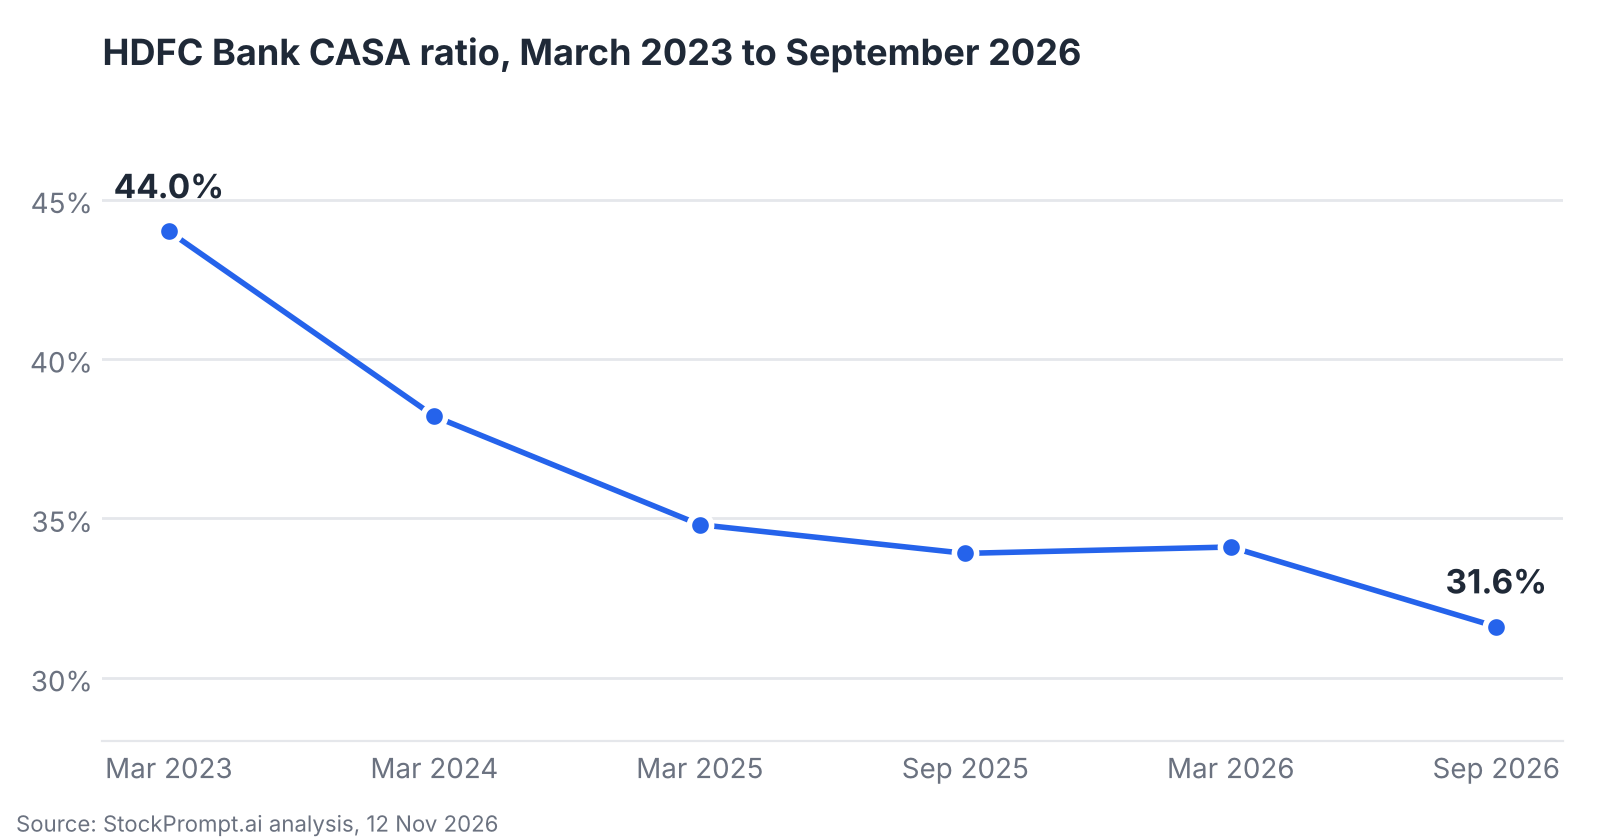
HDFC Bank’s CASA ratio has fallen from 44.0% to 31.6% in three and a half years. Source: StockPrompt.ai analysis.
There may be a turning point. Analysts say Q2 margins appear to be at a trough, and lending rates were raised by up to 15 basis points. If NIM on earning assets stops falling from 3.32%, profit growth can start to close the gap with loan growth. Until that shows in the numbers, it is a hope rather than a driver. Capital adequacy has also drifted, from 20.0% a year ago to 18.9%.
HDFC Bank Valuation Versus ICICI, Kotak and Axis
At a P/E of about 15.6x, HDFC Bank is cheaper than ICICI Bank (19.28x), Kotak Mahindra Bank (23.14x) and Federal Bank (17.28x), and dearer than Axis Bank (14.01x). Against the peer-set median of 12.8x, though, it carries a 22% premium. Price-to-book is 1.82x, and the price is 2.07x the latest book value of ₹391.39.
The gap to ICICI Bank and Kotak has a clear cause: growth. HDFC Bank’s latest quarterly profit growth of 5.55% is the lowest among large private peers, against 22.28% for ICICI Bank, 26.34% for Kotak and 39.38% for Axis Bank. The chart below labels the position “quality at premium valuation”: quality rank 2 of 7 and size rank 1 of 7, but profit-growth rank 6 of 7.
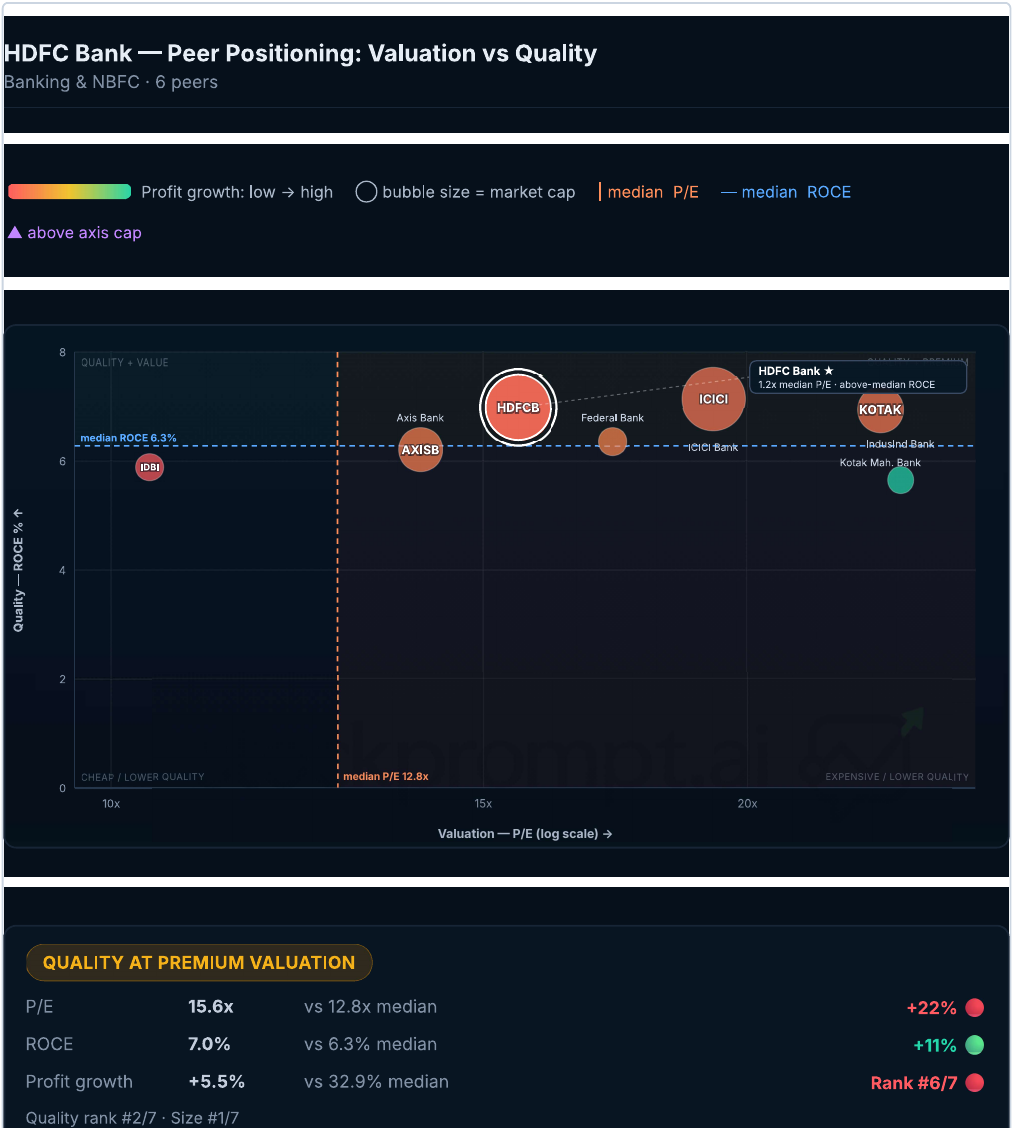
Peer positioning: valuation (P/E) against quality (ROCE). Bubble colour shows profit growth and bubble size shows market cap. Source: StockPrompt.ai.
Our model scores valuation 55/100 and calls it “valuation-constrained”. P/E is the strongest part of that score (17th percentile among peers), while P/B is the weakest, at 40/100. Forward earnings estimates were not available, so no forward multiple is built. Further upside needs earnings to catch up with the price.
Technical View and Model Levels
The trend is up but stretched. The stock trades about 11.6% above its 50-day moving average and about 2.4% above its 200-day moving average. MACD is strongly bullish, ADX is 28.1 (a trending market) and volume shows accumulation. But RSI is about 75 (overbought), the price sits near the upper Bollinger band (₹817.37), and the stock is up about 21% in roughly 10 sessions.
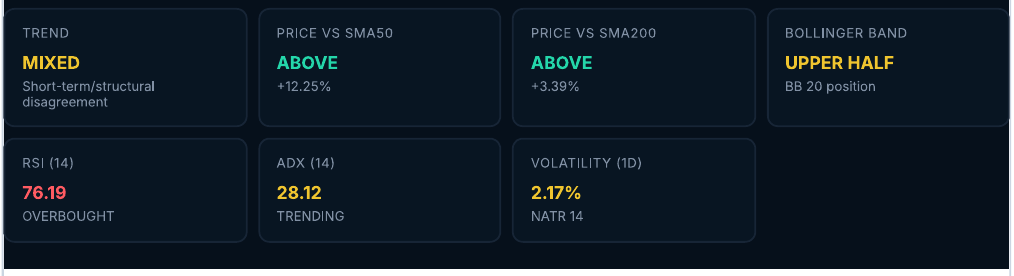
Technical indicator panel from StockPrompt.ai. Values can differ slightly from the summary figures quoted in the text.
Price is also at the Fibonacci 61.8% retracement level (₹805.99), with ₹844.85 (50%) and ₹883.71 (38.2%) above it. The Parabolic SAR is bullish at ₹725.57.
Model levels for education (medium term, 2–3 months):
| Level | Price | vs CMP of ₹808.55 |
|---|---|---|
| Favourable zone | ₹787.70–₹801.60 | Below CMP |
| Upside potential, base case | ₹843.30 | +4.30% |
| Upside potential, bull case | ₹860.68 | +6.45% |
| Risk level | ₹756.42 | −6.45% |
The bear scenario sits at ₹765.11. At the current price, reward-to-risk is only 0.67x on the base case. It improves to 1.27x (base) and 1.73x (bull) near the favourable zone, and the model calls the bull case “tactical only, not a fair-value objective”. These are model outputs for education, not trading advice.
Key Risks and What to Watch
- Governance: the part-time chairman resigned on 18 Mar 2026, saying certain practices did not align with his values. Concerns are easing but not fully resolved, and a general meeting is scheduled for 21 Nov 2026. A search found no specific fresh regulatory penalty.
- Margin pressure: term deposits are growing fastest, CASA is falling and asset yields are drifting lower.
- Quality of growth: deposit growth includes the one-off FCNR(B) lift of about 4 percentage points, and ₹548 bn of Q2 retail advances are FCNR leverage loans.
- Stretched setup: RSI near 75 and a roughly 21% run in about 10 sessions raise the odds of a pause.
- Rates and liquidity: the US 10-year yield is 4.98%, markets expect a Fed hike in December, and domestic institutions (DIIs) have sold for nine sessions.
Foreign flows are the counterweight. Foreign institutional investors (FIIs) bought ₹12,563 Cr on 11 Nov, and Jefferies lists HDFC Bank among likely beneficiaries of a foreign-flow revival. Still, FII holding fell 2.43 percentage points to 39.39% in September 2026, while DII holding rose 1.69 points to 43.44%. There is no promoter holding and no pledge.
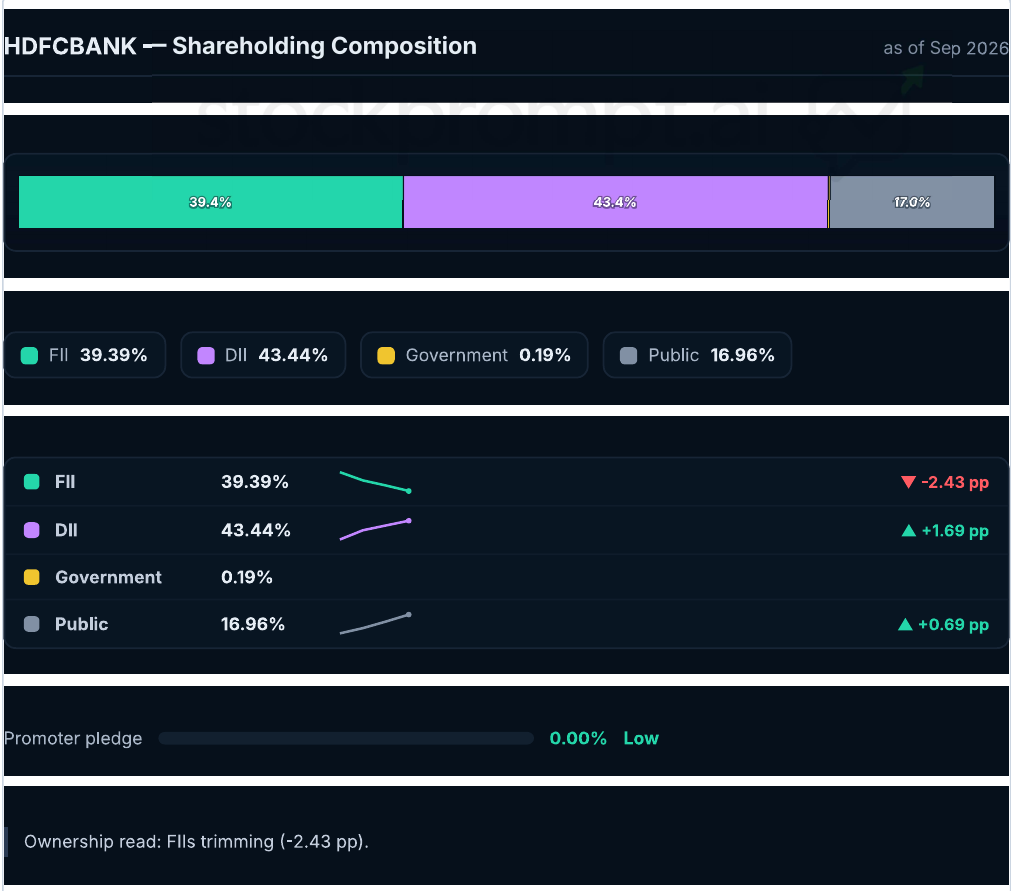
Shareholding as of September 2026. Source: StockPrompt.ai.
What to watch next: NIM on earning assets versus 3.32%; the CASA ratio versus 31.6%; loan growth excluding FCNR leverage loans; the credit-deposit ratio (96.8%) and liquidity coverage (about 113%); credit cost and gross NPA (0.44% and 1.11%); and the board changes.
The Takeaway on HDFC Bank After the Rebound
HDFC Bank has the franchise: clean assets, steady returns and loan growth broadening across retail and SME. What it lacks, for now, is profit growth to match its balance sheet, and the market has priced in a recovery that has not yet reached the earnings line. The near-term score is 75/100 with a neutral bias, helped by returning foreign flows and softer crude, but capped by an overbought RSI and high US yields. The swing factor is NIM: if it recovers from the trough, the case strengthens; if not, the rebound may need to consolidate.
Want to run the same analysis on any NSE or BSE stock? Try StockPrompt.ai and ask your own question.
Try This on StockPrompt.ai
HDFC Bank: can loan growth and margins drive the next rally?
Paste any NSE or BSE stock into StockPrompt.ai and ask the same question to get factor scores, peer comparison, model levels and risks in one report.
Frequently Asked Questions
Is HDFC Bank stock overbought?
In the short term, yes. RSI is about 75, the price is near the upper Bollinger band, and the stock is up about 21% in roughly 10 sessions.
What is HDFC Bank’s NIM?
NIM was 3.16% on total assets and 3.32% on earning assets in Q2 FY27, down from 3.3% and 3.4% a year earlier.
Why is HDFC Bank’s P/E lower than ICICI Bank’s and Kotak’s?
Profit growth is the reason. HDFC Bank’s latest quarterly profit grew 5.55%, against 22.28% for ICICI Bank and 26.34% for Kotak, and its P/E is about 15.6x against 19.28x and 23.14x.
Disclaimer: This is AI-generated analysis for educational purposes only. AI can make mistakes, so verify data independently. It is not SEBI-registered investment advice. Please consult a SEBI-registered advisor before making investment decisions.
Sources: StockPrompt.ai analysis (12 Nov 2026 session), HDFC Bank Q2 FY27 results and earnings presentation, earnings call transcript, exchange filings, annual report, market news and publicly available peer financials.