

Bajaj Finance’s ₹11,700 Cr QIP opened on 12 November 2026, weeks after Q2 FY27 results showed assets under management (AUM) up 26.5% while gross NPA fell to 1.06%. That is a rare pairing: faster growth with no visible credit strain. This Bajaj Finance share price analysis uses the StockPrompt.ai model output dated 12 November 2026 to test how long that can last. The one-line verdict: credit quality is holding up, but at a 34.08x P/E the price leaves little margin for error.
Bajaj Finance Q2 FY27 results: growth up, loan losses contained
Growth accelerated while credit metrics improved, which is the core of the Q2 FY27 story. AUM reached ₹5,84,624 Cr, up 26.5% year on year and faster than the 22% growth in Q4 FY26. Net AUM added in the quarter was ₹37,680 Cr.
| Metric | Q2 FY27 | A year ago |
|---|---|---|
| AUM | ₹5,84,624 Cr (+26.5%) | ₹4,62,261 Cr |
| Gross NPA / net NPA | 1.06% / 0.42% | 1.24% / 0.60% |
| Loan loss to average AUF | 1.56% (1.32% ex-overlay) | 1.88% |
| Provisions as % of NII | 16.2% | 19.3% |
| ROE (Q2, annualised) | 20.6% | 19.1% |
Consolidated profit after tax (PAT) rose 29% to ₹6,367 Cr, and H1 FY27 PAT was ₹12,447 Cr, up 28%. Net interest income (NII) grew 24% to ₹13,335 Cr, and net total income grew 23% to ₹15,974 Cr.
Loan-loss provisions rose only 4.1% to ₹2,166 Cr, even with a ₹337 Cr macro overlay included. Capital adequacy is 20.33% (Tier-I 19.43%) and stage 3 provision coverage is 60%. For a primer on reading lender results, see our quarterly results explainer.
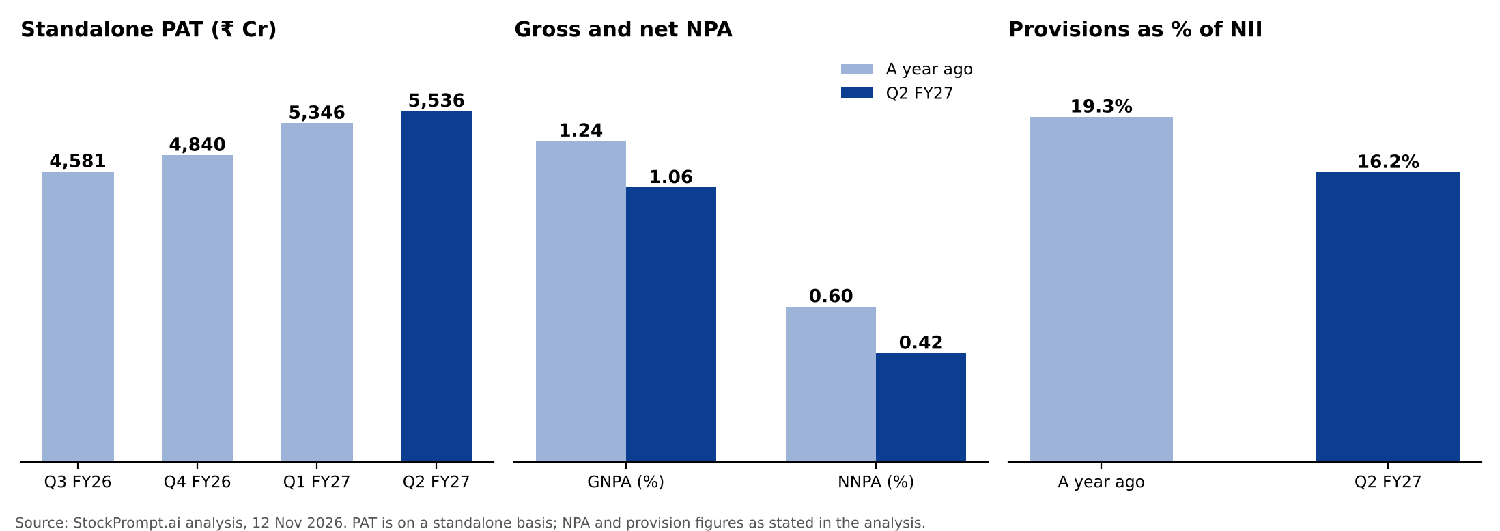
Figure 1. Standalone PAT over four quarters, with NPA and provision ratios against a year ago.
Growth drivers: a wider customer base and raised guidance
Management raised FY27 AUM growth guidance to 26-27% from 23-25%, citing H1 strength and early festive demand. Medium-term guidance is unchanged at 23-25% for both AUM and profit growth, with ROE of 19-21% and fee income growth of 15-18%. Opex to net total income is guided to improve by 25-40 bps in FY27.
The customer base keeps widening. Bajaj Finance has 128.85 MM customers, up from 69.1 MM in March 2023, with 4.42 MM added in Q2 alone. The cross-product franchise stands at 75.5 MM, with about 6.07 products per customer (March 2026).
Scale shows in efficiency: opex to total income is about 33% and 52.5 MM new loans were booked in FY26. Bajaj Housing Finance adds AUM of ₹1,58,205 Cr, GNPA of 0.29% and PBT growth of 18%.
The backdrop helps too. NBFC credit grew 15.4% year on year to ₹61.69 lakh crore in September 2026, per RBI data, and a recovery in MSME lending is expected around Q2 and Q3 FY27.
The biggest weakness: a 34x multiple with little room for error
Valuation is the weak point, and the model scores it just 17/100. The stock trades at a P/E of 34.08x and a P/B of 5.37x, which puts its P/E at the 100th percentile against peers. The thesis therefore depends on credit costs staying low.
Credit risk has shifted toward newer lending areas rather than the legacy book. Stage 2 and Stage 3 assets rose in the quarter, partly from a transitional movement in the gold-loan book, though management says this will not affect credit costs. Gold loan AUM is about ₹24,000 Cr, branches are planned to grow from 2,022 to 2,700-2,800 by FY27 end, and RBI data show system-wide gold-jewellery credit up 66.1% in September 2026.
Management is de-risking elsewhere. It is cutting two-wheeler and three-wheeler origination from about 7% of the book toward 3.5%, and trimming exposure in drought-hit districts, mainly Maharashtra. It cited prudent overlays of about ₹512 Cr, plus ₹350-500 Cr of loss-given-default floor provisions.
Cash-flow measures are weaker: interest cover is 2.1x, and free cash flow is -₹41,693 Cr, which the analysis calls typical for a growing lender.
Valuation versus peers: quality is real, growth is not the fastest
Bajaj Finance is the largest and priciest name in its peer group, but not the fastest grower. The model ranks it first on size and third of seven on quality, yet seventh of seven on profit growth. Its latest quarterly profit growth of 28.5% compares with a peer median of about 45.9%.
| Metric | Bajaj Finance | Peer comparison |
|---|---|---|
| P/E | 34.08x | Peer median about 19x to 21x, depending on the calculation |
| P/B | 5.37x | Peer median 2.90x |
| ROCE | About 11% | Peer median 9.9% |
| Latest quarterly profit growth | 28.5% | Peer median about 45.9% |
The premium rests on scale, ROA and consistency, not on faster growth. The analysis says past growth and ROA justify some premium, but not much further re-rating. On trailing EPS of ₹32.62, the model’s base-case level implies about 35.9x.
Put simply, this Bajaj Finance share price analysis finds a high-quality lender whose multiple already reflects it. To compare other financial names, read our Shriram Finance, Cholamandalam and Kotak Mahindra Bank posts.
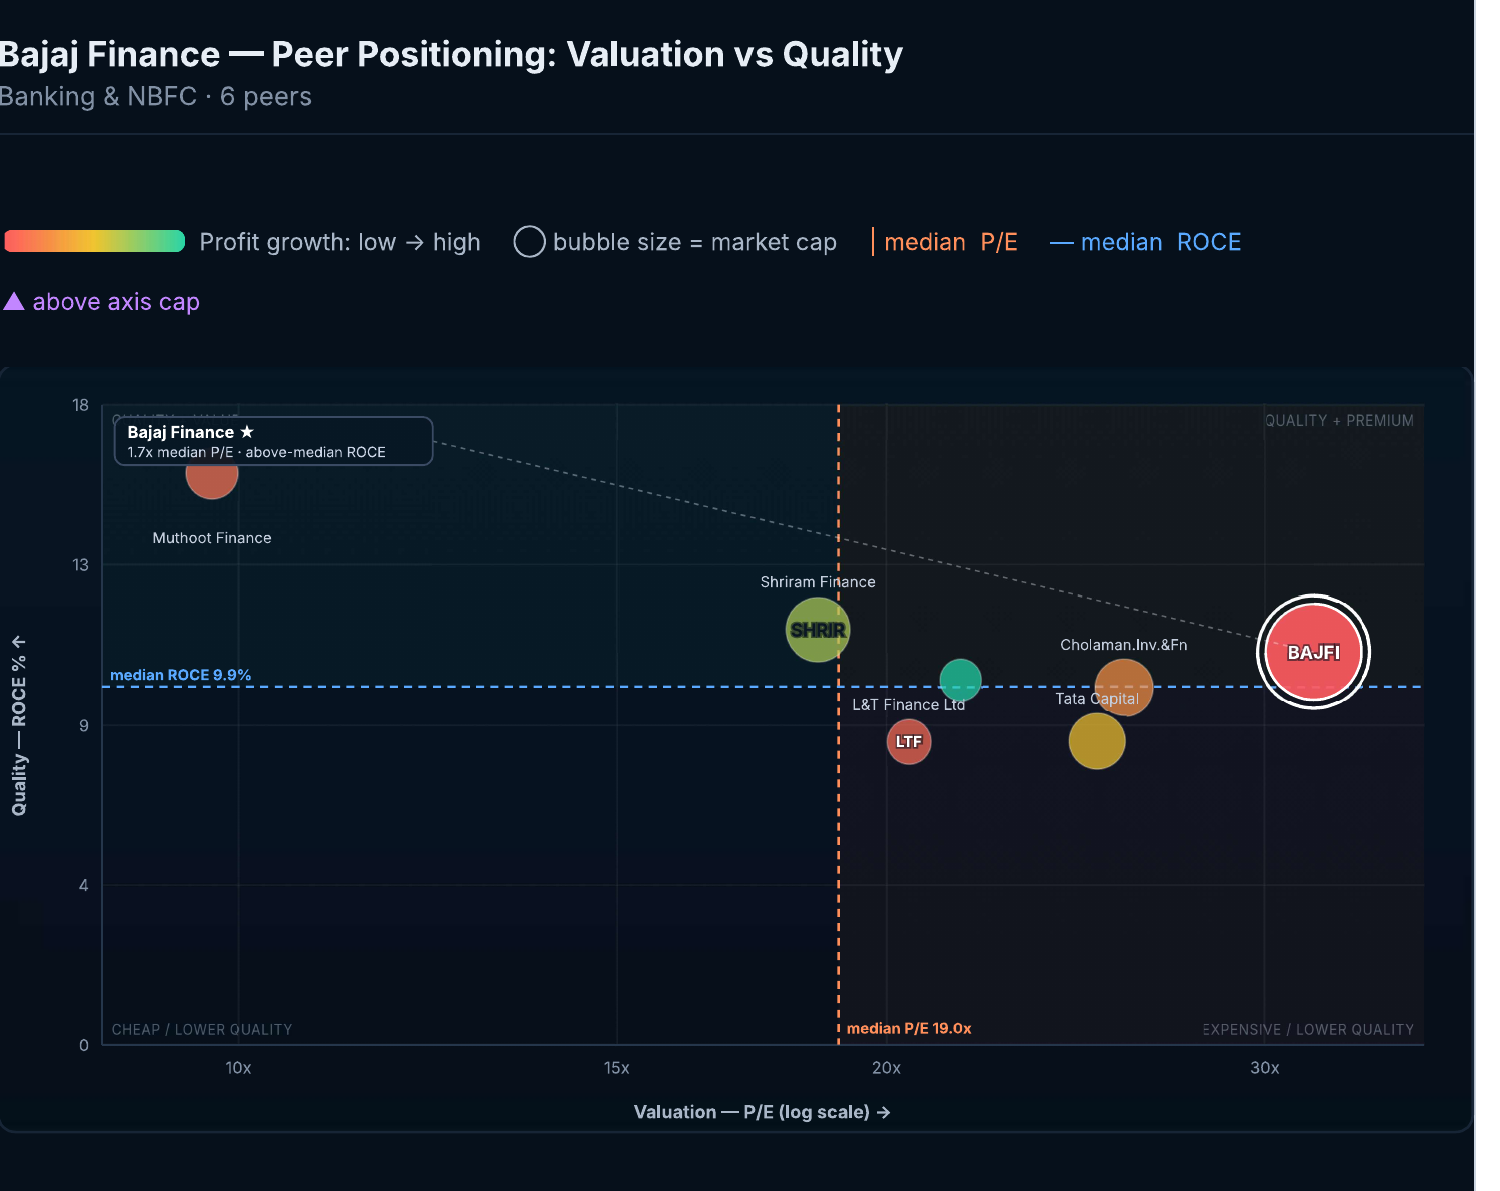
Figure 2. Peer positioning: valuation (P/E, log scale) against quality (ROCE), bubble size by market cap.
Technical view and model levels: strong trend, stretched momentum
The trend is strong, but momentum is stretched. The shares traded at ₹1,111.65 on 12 November 2026 (about 12:52 IST), up 3.05% on the day, against a 52-week high of ₹1,158.80. Price is about 11% above the 50-day average and about 14% above the 200-day average.
MACD is strongly bullish and ADX is 27.1, but RSI of 71.5 on the live chart is in overbought territory. Technicals score 84/100 in the model, against 17/100 for valuation.
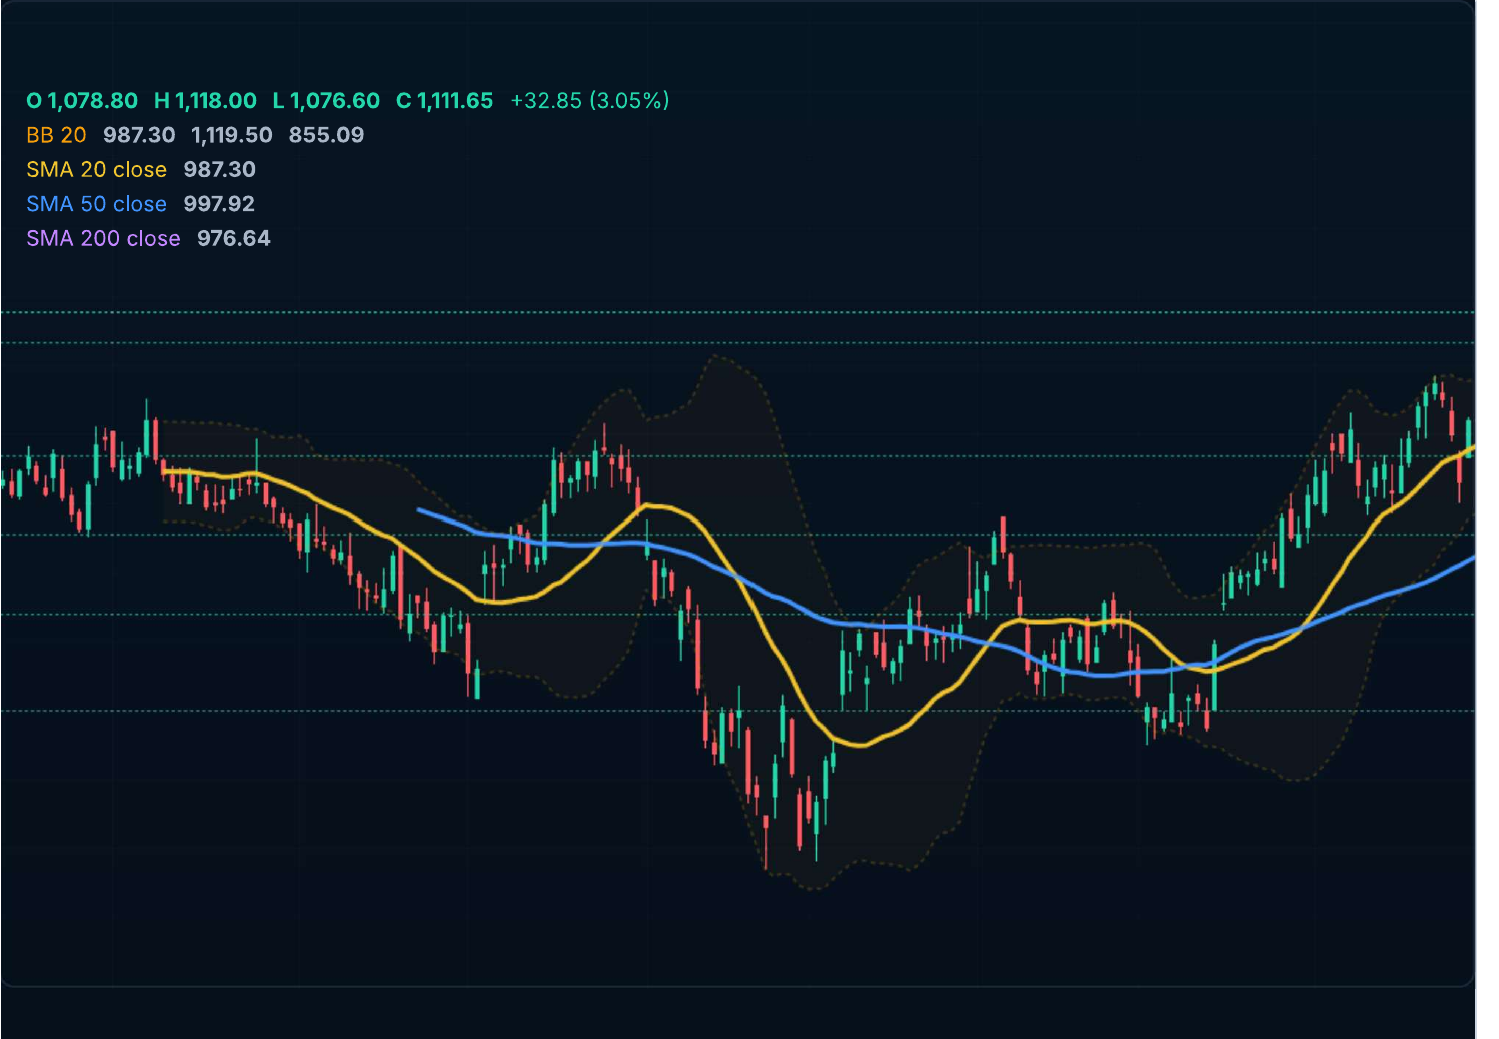
Figure 3. Daily candles with Bollinger Bands and 20, 50 and 200-day averages, as exported from the analysis.
The table below shows model levels for education, not advice. The model says the upside is valuation-constrained, so these are tactical levels rather than a fair-value objective.
| Model level (medium-term, 2 to 4 months) | Value |
|---|---|
| Favourable zone | ₹1,075.90 to ₹1,099.73 |
| Higher scenarios | ₹1,171.23 base (+5.4%); ₹1,201.03 bull |
| Lower scenario | ₹1,037.17 |
| Risk level (breakdown) | ₹1,022.27 |
| Risk-reward at ₹1,111.65 | 0.67x base; 1.00x bull |
| Risk-reward near favourable zone | 1.27x base; 1.73x bull |
At the current price, risk-reward on the base case is only 0.67x. The model’s coming-session read is neutral (69/100), and it notes that QIP pricing and supply could limit gains between ₹1,111 and ₹1,158.
Risks and what to watch
Six items will decide whether growth stays clean:
- Gold-loan quality: Stage 2 and Stage 3 assets, and whether credit cost holds near 1.3-1.6% of average AUF.
- Margins: NIM compression against the 10-15 bps guidance.
- Mix: the share of two- and three-wheeler loans, and the MSME recovery.
- QIP: final pricing and institutional demand.
- Rural stress: monsoon and rural conditions, especially in Maharashtra.
- Fee income: IRDAI commission caps on credit-linked insurance.
Margins face a squeeze. Management assumes two more repo hikes and guides NIM compression of 10-15 bps, against about 5 bps in H1. Macro stresses it flagged include El Niño, a monsoon at 87% of normal and oil at $100-110.
Short-term supply matters too. The QIP is priced at an indicative ₹1,025, a 5% discount to the last close of ₹1,078.80, with dilution of up to 1.8%. On the supportive side, promoter Bajaj Finserv is subscribing about ₹5,799 Cr in warrants at ₹1,010 each.
Promoters hold 54.67% with no pledge. FII holding fell 0.42 percentage points to 19.78%, while DII holding rose 0.66 points to 16.96%. The analysis found no material unresolved legal or regulatory action.
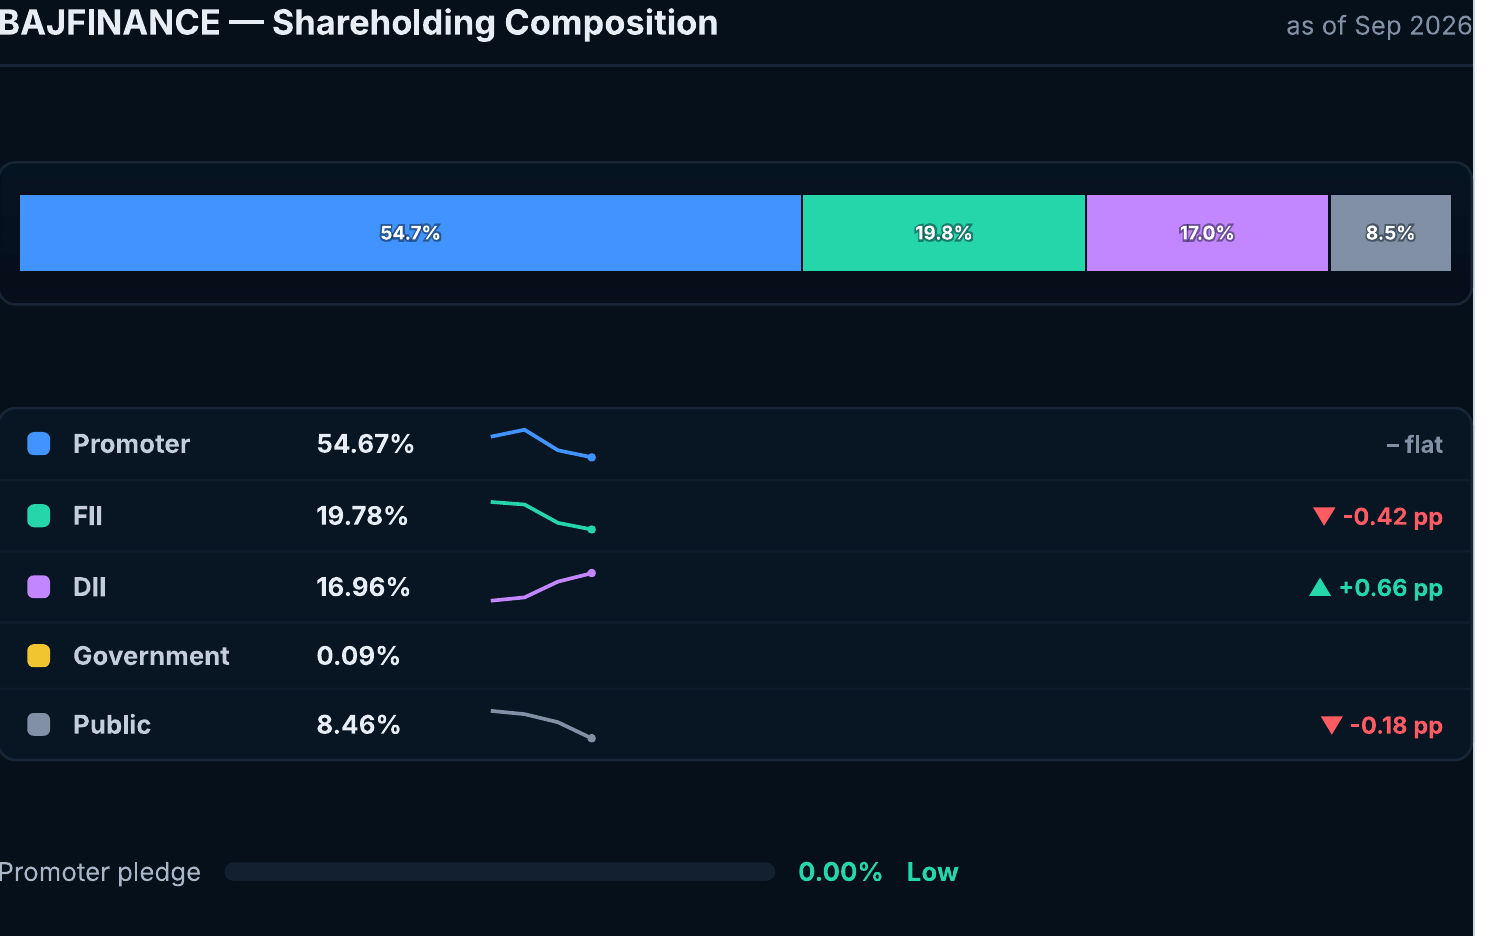
Figure 4. Shareholding composition, September 2026.
Conclusion: watch credit cost first, price second
Bajaj Finance has answered the credit-risk question well so far: growth recovered while provisions grew far more slowly than income. The harder question is price, because a premium multiple, fresh QIP supply and fast-growing gold loans leave less room for any slip in credit costs.
For anyone following this Bajaj Finance share price analysis over the model’s two-to-four-month horizon, the useful habit is to track credit cost and Stage 2 and 3 assets before the share price. You can run the same checks on any NSE or BSE stock through the StockPrompt.ai features or create a free account.
Try This on StockPrompt.ai
Bajaj Finance Stock Analysis 2026: Can Growth Recover Without Increasing Credit Risk?
Frequently Asked Questions
What is the Bajaj Finance share price analysis for November 2026?
As of 12 November 2026, Bajaj Finance trades at ₹1,111.65. The StockPrompt.ai model scores it 68/100, with strong fundamentals (86) and technicals (84) but weak valuation (17). P/E is 34.08x and P/B is 5.37x.
Did Bajaj Finance’s credit quality worsen as growth picked up?
Not on reported Q2 FY27 numbers. AUM grew 26.5% while GNPA fell to 1.06% from 1.24% and NNPA to 0.42% from 0.60%. Stage 2 and 3 assets did rise in the quarter, partly from a transitional gold-loan movement that management says will not affect credit costs.
What is the Bajaj Finance QIP and why does it matter for the share price?
The ₹11,700 Cr QIP opened on 12 November 2026 with a floor price of ₹992.25. Its indicative price of ₹1,025 is a 5% discount to the last close of ₹1,078.80, with dilution of up to 1.8%, so the model flags supply as a near-term limit on gains.
Disclaimer: This is AI-generated analysis for educational purposes only. AI can make mistakes, so verify all data independently. It is not SEBI-registered investment advice. Please consult a SEBI-registered advisor before making investment decisions.
Sources: Company filings and Q2 FY27 investor presentation, earnings call commentary, exchange filings, market and business press, and public peer financials, as compiled in the StockPrompt.ai analysis dated 12 November 2026.