

Kotak Mahindra Bank reported Q2 FY27 consolidated profit of ₹5,645 Cr, up about 26% year on year, while gross NPA slipped to 1.04%. That is the turnaround investors wanted, and the shares have already reached a 52-week high. This Kotak Mahindra Bank share price analysis uses the StockPrompt.ai model output dated 12 November 2026 to separate what the earnings prove from what the price already assumes. The one-line verdict: the earnings recovery looks real, but valuation is stretched and the model’s risk-reward is thin at ₹487.20.
Kotak Mahindra Bank Q2 FY27 results: profit up, credit costs down
Asset quality improved on every line in Q2 FY27, and that is what lifted profit. Consolidated profit rose 26.34% to ₹5,645 Cr, up 3% on the previous quarter, while standalone profit grew about 29% to ₹4,212 Cr. Provisions fell 15% year on year to ₹803 Cr at the standalone level.
| Metric | Q2 FY27 | A year ago | Q1 FY27 |
|---|---|---|---|
| Gross NPA | 1.04% | 1.39% | 1.18% |
| Net NPA | 0.24% | 0.32% | 0.27% |
| Credit cost | 0.35% | 0.79% | 0.46% |
| Net interest margin (NIM) | 4.31% | 4.54% | 4.53% |
| CASA ratio | 38.2% | 42.3% | n/a |
| Provision coverage | 78% | 77% | n/a |
Consolidated sales were ₹19,856 Cr, up 15.45%. Standalone net interest income (NII) rose 16% to ₹8,459 Cr, and standalone operating profit rose 21% to ₹6,382 Cr. For a wider guide to reading bank results, see our quarterly results explainer.
Credit cost fell from 0.79% a year ago to 0.35%, which is why profit grew faster than sales. Net NPA of 0.24% and provision coverage of 78% also point to a cleaner book than a year earlier.
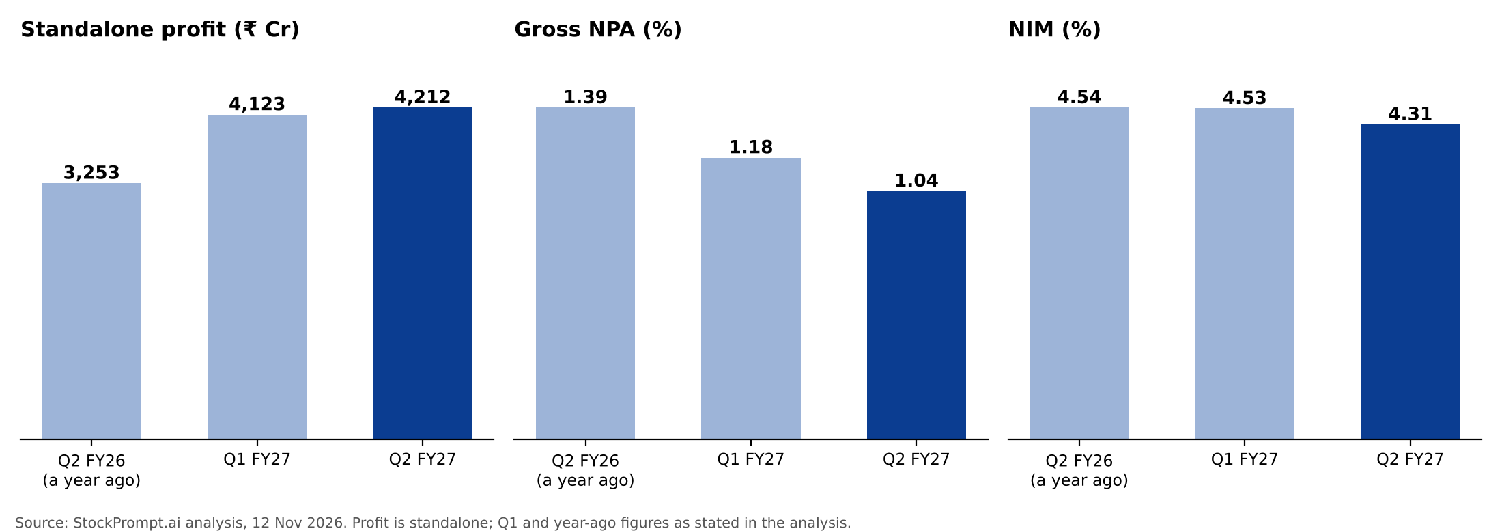
Figure 1. Standalone profit, gross NPA and NIM: Q2 FY26, Q1 FY27 and Q2 FY27.
Growth drivers: faster loans, rising fees and a leaner cost base
Faster lending and tighter costs are doing most of the work. Net advances rose 25% year on year to ₹5,77,295 Cr, although core growth was 19% once FCNR(B)-backed loans and the portfolio transferred from Kotak Mahindra Investments are excluded. Management aims to grow loans at 1.5 to 2 times nominal GDP.
Fee and services income rose 21% to ₹2,926 Cr. Cost-to-assets has fallen steadily over six quarters to 2.40%, from 2.67% a year ago. Slippages fell 24% year on year and the unsecured book is improving.
The wider group adds support. Subsidiaries earned ₹1,450 Cr, up 18%, which is 26% of consolidated profit: Kotak Securities ₹348 Cr, Kotak Prime ₹251 Cr, Kotak Life ₹198 Cr and Kotak AMC ₹287 Cr. Capital adequacy of 21.9% (CET1 21.4%) leaves room to grow faster.
The franchise itself is broad. Kotak has 2,276 branches, Kotak AMC’s average AUM was ₹5,70,041 Cr and Kotak Securities held a 13.2% overall market share, all as of March 2026. The promoter pledge is 0%.
The biggest weakness: margin compression
Net interest margin is the weak spot, having fallen to 4.31% from 4.53% in a single quarter. That is a 22 basis point drop, and it arrived alongside a lower CASA ratio of 38.2% against 42.3% a year ago. Management says FCNR(B)-related pressure will be offset progressively, but the full-quarter impact comes first.
Deposits rose 23% to ₹6,51,491 Cr, yet only 13% excluding FCNR(B) inflows. About ₹55,344 Cr of FCNR(B) deposits were raised in the quarter, and CASA excluding them was 41.8%. Foreign-currency money is rate- and currency-sensitive, so it may not stay.
NIM compression was also the common watch-point across brokerages after the results. HDFC Securities additionally flagged cautious loan growth and sub-optimal leverage as drags on ROE. The margin matters more because the shares already carry a premium: the analysis warns NIM could fall further before it recovers.
Valuation versus peers: a premium that needs earnings to keep up
Kotak carries a clear premium, and the model scores valuation just 40/100. At a P/E of 23.88x it sits well above the industry P/E of 13.4x and above every peer shown except IndusInd Bank (24.01x). Against a peer median P/E of 12.8x, the premium is roughly 1.8 times.
| Metric | Kotak Mahindra Bank | Comparison |
|---|---|---|
| P/E | 23.88x | Industry 13.4x; peer median 12.8x |
| P/B | 2.43x | HDFC Bank 2.07x; ICICI Bank 2.93x |
| Latest quarterly profit growth | 26.34% | ICICI Bank 22.28%; Axis Bank 39.38%; Federal Bank 51.08% |
| ROCE | 6.98% | Peer median 6.3% |
| ROE | 11.4% | Modest for 2.4x book |
The premium rests on improving return ratios, with ROA of 1.92% standalone and 2.10% consolidated, and on a clean balance sheet. Yet ROE of about 11.4% is modest for 2.4x book, and brokerages say excess capital weighs on returns. Compare how the sector leaders stack up in our HDFC Bank, ICICI Bank and Axis Bank posts.
For context only, and not used in the model score, published brokerage price objectives range from ₹480 (HDFC Securities) to ₹550 (Nuvama). Against ₹487.20, that is roughly -1.5% to +12.9%.
Kotak ranks third of seven peers on quality and third on size, but fourth on profit growth, at 26.3% against a peer median of 30.8%. In short, this Kotak Mahindra Bank share price analysis finds quality that is real but already paid for.
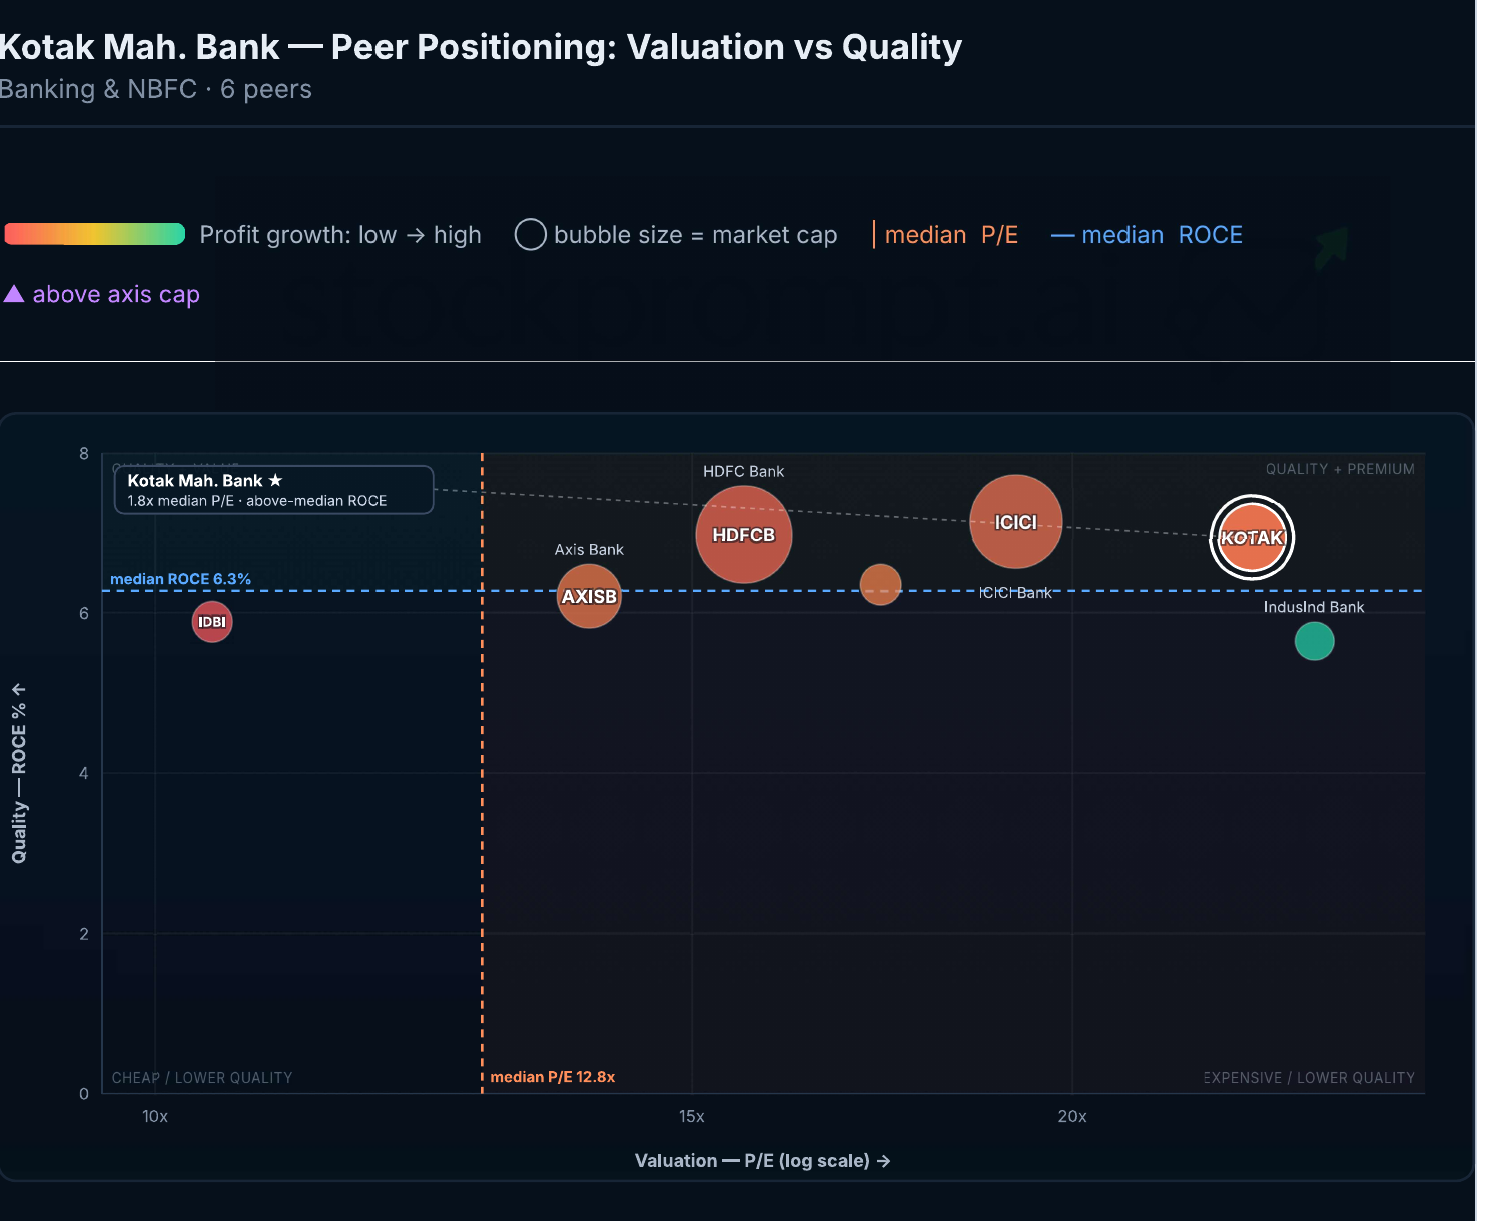
Figure 2. Peer positioning: valuation (P/E, log scale) against quality (ROCE), bubble size by market cap.
Technical view and model levels: strong trend, stretched momentum
The trend is strong, but momentum is stretched. The shares traded at ₹487.20 during market hours on 12 November 2026, at a 52-week high, about 11% above the 50-day average and about 20% above the 200-day average. ADX of 43.2 confirms a trending market and MACD is bullish, but RSI of 73.2 is in overbought territory.
Bollinger %B of 91.92 shows the price pressed against the upper band, which fits the overbought reading. In the model, technicals score 93/100 and valuation 40/100, which is why the overall score is 76/100.
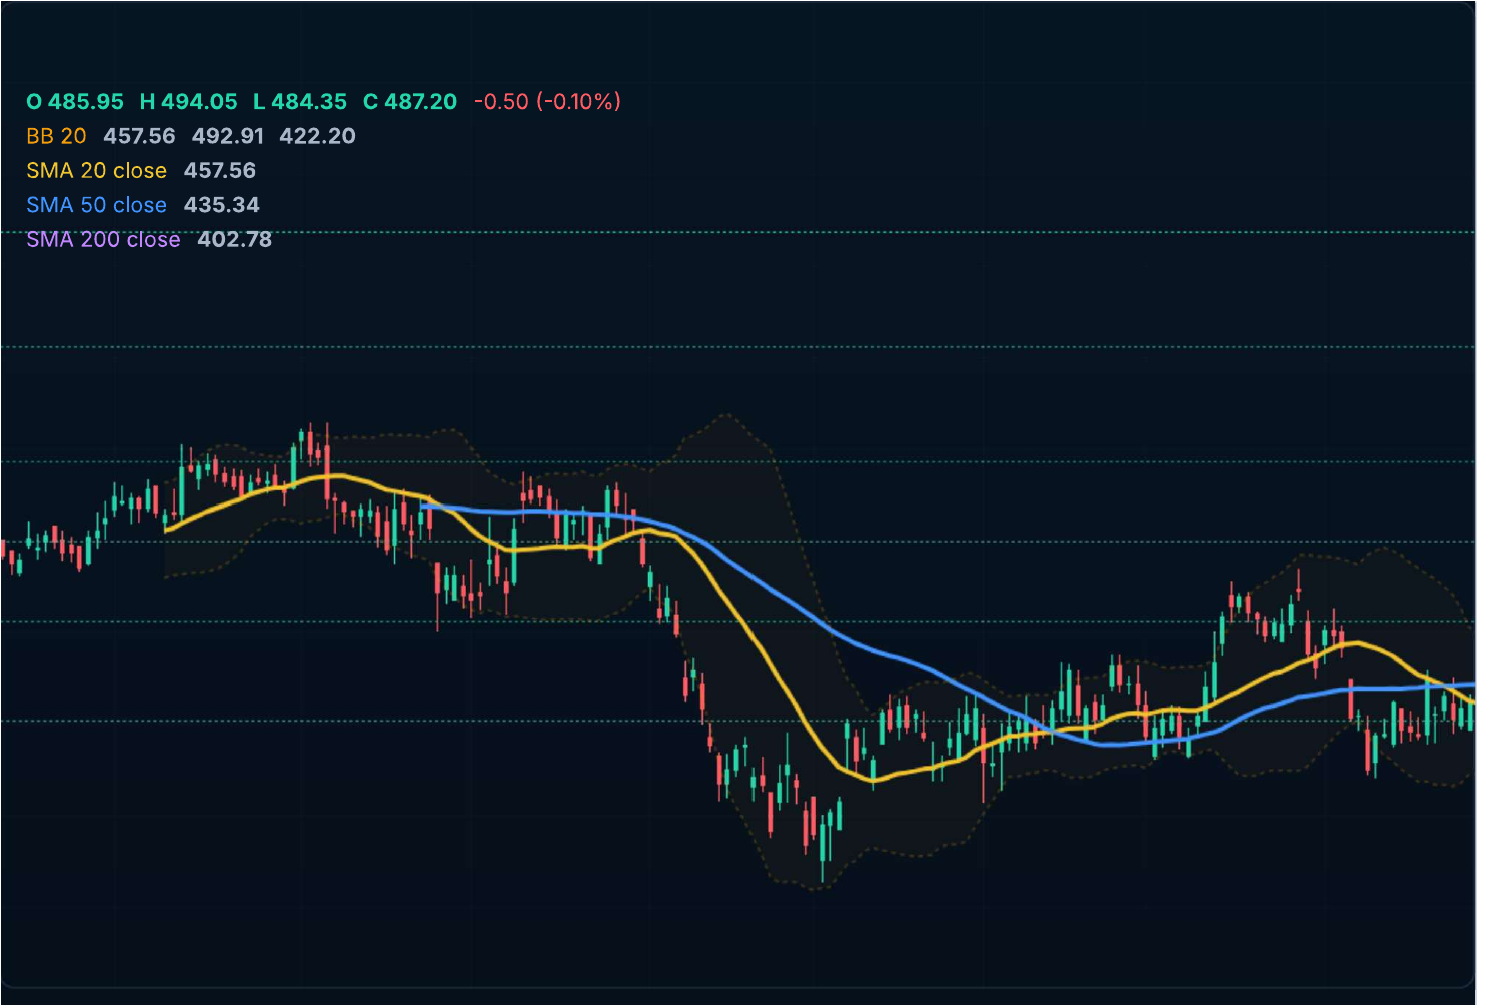
Figure 3. Daily candles with Bollinger Bands and 20, 50 and 200-day averages, as exported from the analysis.
The table below shows the model levels for education. They are not advice, and the model labels the higher levels “tactical only”, not a fair-value objective.
| Model level (medium-term, tactical) | Value |
|---|---|
| Favourable zone | ₹474.90 to ₹483.10 |
| Higher reference levels | ₹507.70 base (+4.2%); ₹517.95 bull (+6.3%) |
| Risk level | ₹456.45 (-6.3% from ₹487.20) |
| Risk-reward at ₹487.20 | 0.67x base; 1.00x bull |
| Risk-reward near favourable zone | 1.27x base; 1.73x bull |
| Supports | 23.6% Fib ₹456.01; Parabolic SAR ₹458.74; 38.2% Fib ₹436.40 |
At the current price the model finds risk-reward unfavourable, improving only on pullbacks. Its coming-session read is neutral (78/100), and consolidation near ₹483 to ₹488 would be normal after a run to a 52-week high.
Risks and what to watch
Six numbers will decide whether earnings outrun the valuation:
- NIM recovery: whether FCNR(B)-related pressure is offset as management expects.
- CASA ratio: whether it moves back toward the 41.8% seen excluding FCNR(B).
- Core loan growth: whether it holds near 19% once one-off boosts fade.
- Credit cost and slippages: the 0.35% credit cost and 0.85% slippage ratio.
- Cost-to-assets: whether it stays near 2.40%.
- Capital deployment: how the 21.9% capital adequacy is used, since it weighs on ROE.
Beyond these, the stock is overbought, so a pullback toward ₹456 to ₹458 is plausible. FII holding fell 0.56 percentage points to 24.65%, while DII holding rose 0.83 points to 38.54%. Mid-October reports also flagged high crude and record foreign outflows. The analysis found no new material regulatory or legal action against the bank.
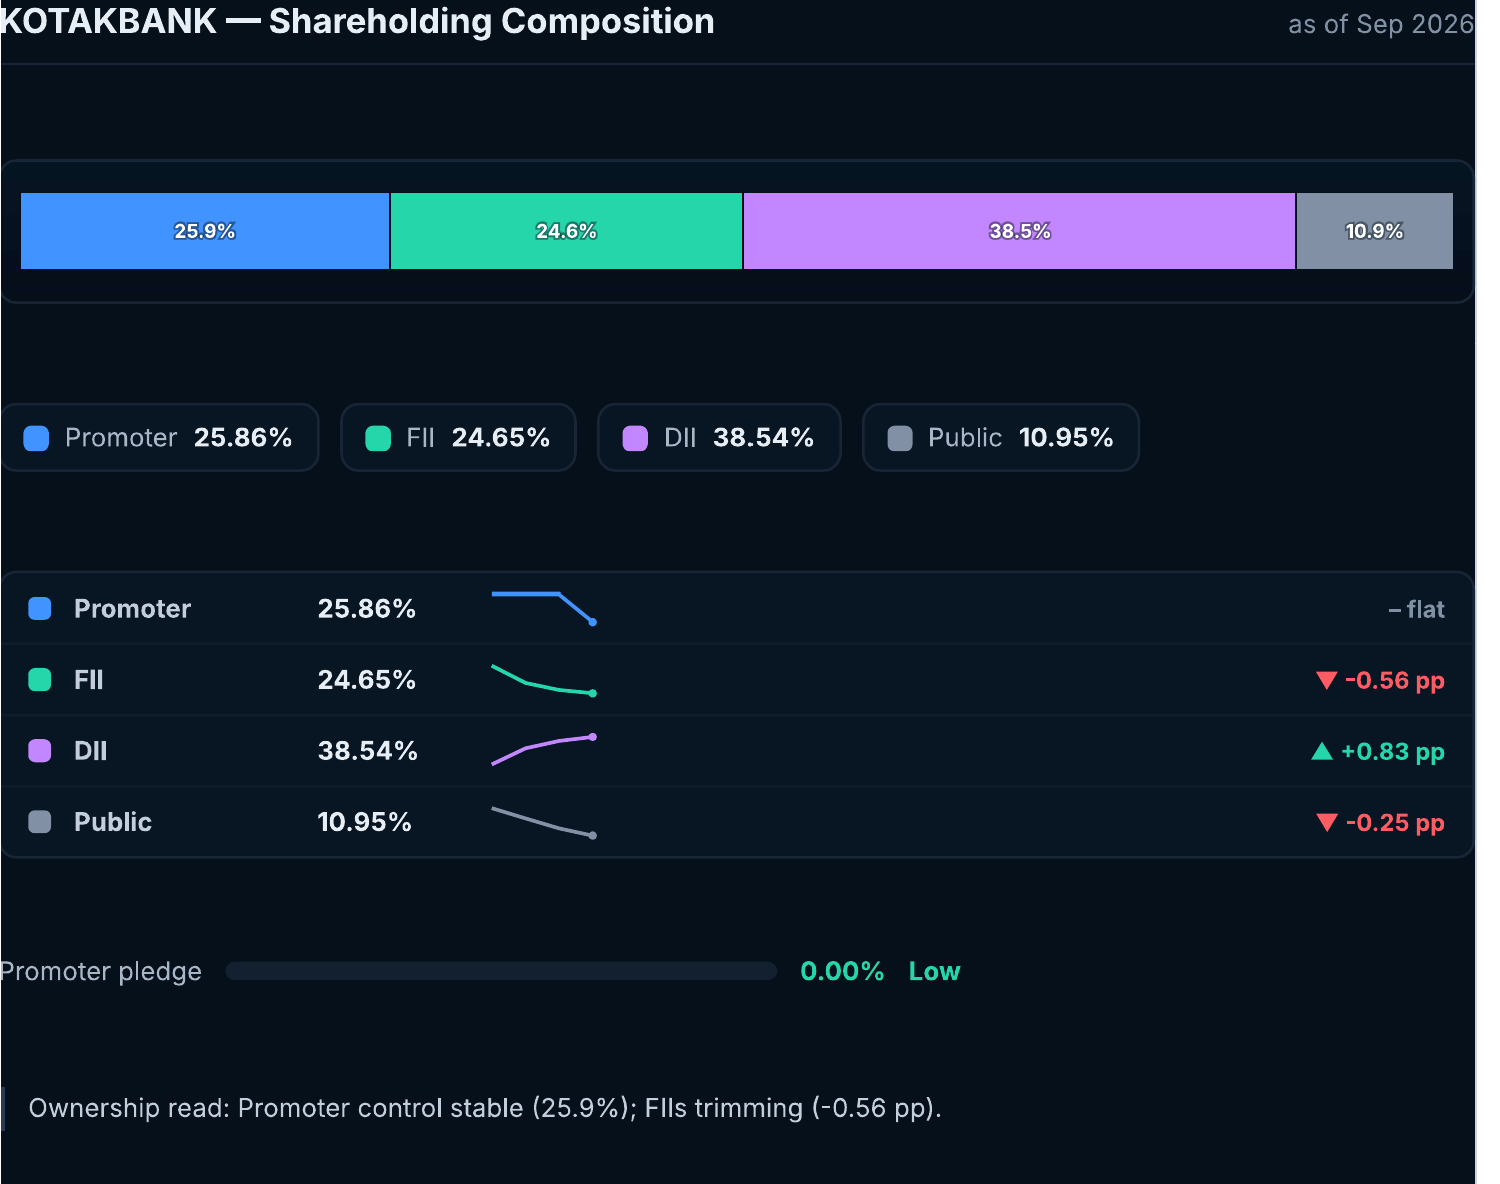
Figure 4. Shareholding composition, September 2026.
Conclusion: good earnings, a demanding price
Taken together, this Kotak Mahindra Bank share price analysis points to a bank whose results have improved faster than its margin. Kotak has shown that asset quality and credit costs can improve together. The next test is the margin: if NIM stabilises and CASA recovers, the premium becomes easier to defend, and if not, the multiple has little cushion. Waiting for evidence is a legitimate stance when the model itself says risk-reward improves only on pullbacks.
To run the same checks on any NSE or BSE stock, explore the StockPrompt.ai features or create a free account.
Try This on StockPrompt.ai
Kotak Mahindra Bank Stock Analysis 2026: Is the Turnaround Finally Gaining Momentum?
Frequently Asked Questions
What is the Kotak Mahindra Bank share price analysis for November 2026?
As of 12 November 2026, Kotak Mahindra Bank trades at ₹487.20, near a 52-week high. The StockPrompt.ai model scores it 76/100, with strong fundamentals (77) and technicals (93) but weak valuation (40). P/E is 23.88x and P/B is 2.43x.
Why did Kotak Mahindra Bank’s NIM fall in Q2 FY27?
NIM fell to 4.31% from 4.53% in Q1, a 22 basis point drop. CASA slipped to 38.2% on FCNR(B) term deposits, and management says the related pressure will be offset progressively, but the full-quarter impact comes first.
Is Kotak Mahindra Bank expensive compared with its peers?
On the model’s numbers, yes. Its P/E of 23.88x compares with an industry P/E of 13.4x, and only IndusInd Bank (24.01x) is higher among the peers shown. Its ROCE of 6.98% is above the 6.3% peer median.
Disclaimer: This is AI-generated analysis for educational purposes only. AI can make mistakes, so verify all data independently. It is not SEBI-registered investment advice. Please consult a SEBI-registered advisor before making investment decisions.
Sources: Company Q2 FY27 results and earnings call, exchange data, published brokerage reports, business press coverage and publicly available peer financials, as compiled in the StockPrompt.ai analysis dated 12 November 2026.