

ICICI Bank grew loans 30.0% year on year in Q2 FY27 and standalone profit 20.1%, with gross NPA down to 1.20%. Yet the shares fell 1.10% on 11 November, a day private banks rallied, after a roughly 10% run in four sessions. This ICICI Bank stock analysis 2026 asks whether a premium to peers is still earned. Our model scores the stock 72/100 and labels it “Bullish, valuation-constrained”. In short: the franchise earns a premium, but the price already reflects it.
Q2 FY27 results: profit and loans both accelerate
ICICI Bank’s earnings grew at the same pace as its balance sheet, which is rare for a lender expanding this fast. Standalone profit after tax (PAT) rose 20.1% to ₹14,843 Cr, and consolidated PAT rose 22.3% to ₹16,333 Cr. Operating expenses grew only 8.5%, so core operating profit rose faster than costs.
| Metric (Q2 FY27) | Value | YoY |
|---|---|---|
| Net interest income (NII) | ₹25,339 Cr | +17.7% |
| Core operating profit | ₹20,805 Cr | +21.8% |
| Standalone PAT | ₹14,843 Cr | +20.1% |
| Fee income | ₹7,795 Cr | +20.1% |
| Loans | ₹18.32 trn | +30.0% |
| Deposits | ₹20.50 trn | +27.1% |
Headline growth is flattered by FCNR(B)-backed loans. Excluding them, loans grew 24.1% and deposits 17%. Provisions fell 6.9% to ₹851 Cr, while treasury swung to a ₹230 Cr loss from a ₹220 Cr gain a year earlier. For a method to read results like these, see our guide to analysing quarterly results using AI.
The chart below shows earnings rising for four straight quarters. Its profit series is on a broader reporting basis, so use the standalone ₹14,843 Cr as the cleaner Q2 figure.
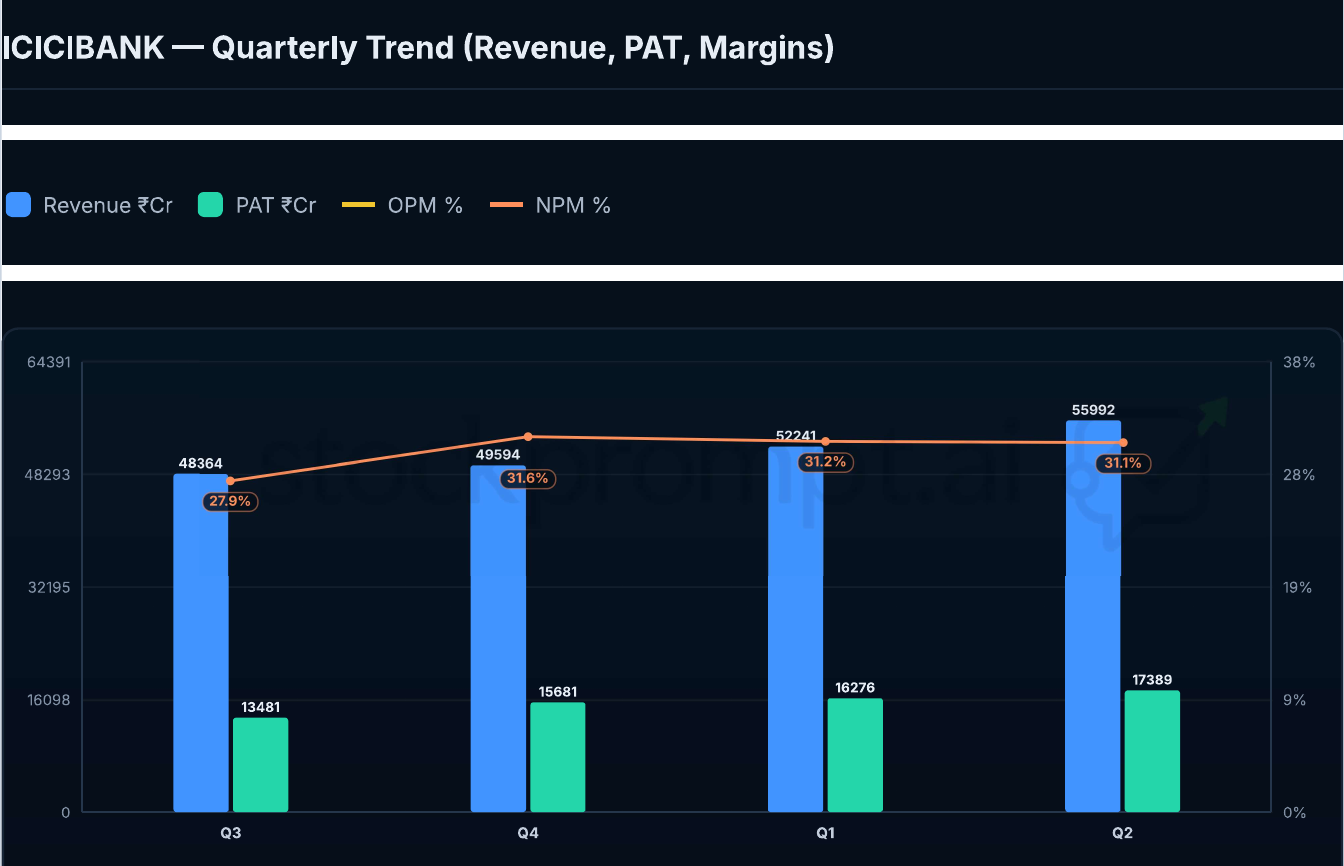
ICICI Bank quarterly trend: revenue, profit and margins. Source: StockPrompt.ai.
What is driving growth at ICICI Bank
Credit growth is broad-based and the asset cycle is cleaner. Advances compounded at about 15.1% a year from March 2023 to March 2026, from ₹10,196 bn to ₹15,539 bn. In H1 FY27, retail and rural loans grew 14.8%, business banking 33.8% and domestic corporate loans 30.6%.
Four strengths stand out:
- Asset quality: gross NPA fell from 2.87% in March 2023 to 1.20% in September 2026, and net NPA is 0.30% against 0.39% a year ago.
- Buffers: provision coverage is 75%, with ₹13,100 Cr of contingency provisions on top.
- Capital: CET-1 is 16.01% against an 8.20% minimum, and total capital adequacy is 16.68%.
- Distribution and funding: branches reached 7,656 (145 added in H1 FY27), up from 5,900 in March 2023, and CASA was 41.4% in March 2026, up from 39.0% in March 2025.
About 75% of fee income comes from retail, rural and business banking. The bank also raised its ICICI Life stake by 2% for ₹1,470 Cr. Banks overall posted roughly 20% aggregate profit growth in Q2, so the sector backdrop is supportive.
The weak point: valuation, not the business
The model’s lowest factor score is valuation, at 28/100, against 80 for fundamentals and 89 for technicals. Price-to-book carries the most weight (50%) and is adjusted for quality. On that basis the stock is expensive even after allowing for its returns.
The bank’s ROA is 2.07% and ROE is 15.9%. These justify some premium, particularly over weaker peers. They do not obviously justify a 50% price-to-book premium to the peer median.
The practical consequence is that the market is already paying for good news. A re-rating from here looks unlikely, so returns depend on earnings compounding, and an earnings miss could hurt the multiple more than it would for cheaper peers.
ICICI Bank valuation versus peers
ICICI Bank trades at a P/E of about 19.2x, against a peer median of 16.45x, which is roughly a 17% premium. Price-to-book is 2.56x on one book-value basis and 2.93x on the peer-table basis, against a 1.95x median. Only Kotak (23.11x) and IndusInd (23.73x) trade on higher P/Es.
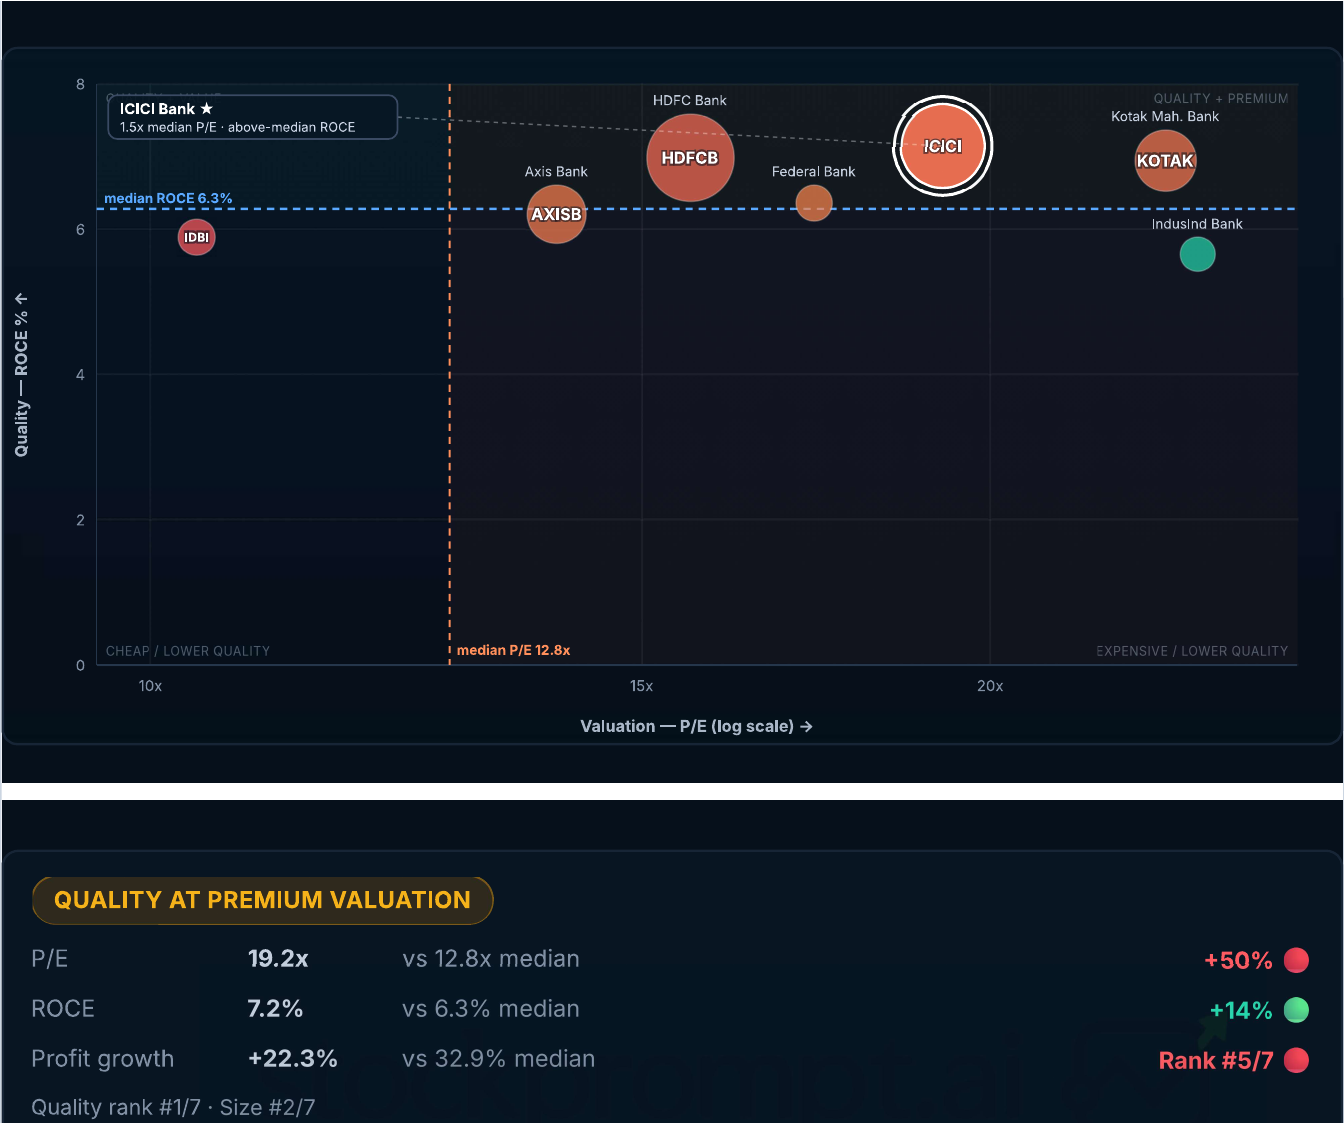
Peer positioning: valuation (P/E) against quality (ROCE). Bubble size shows market cap. Source: StockPrompt.ai.
| Bank | Latest quarterly profit growth |
|---|---|
| Federal Bank | 51.08% |
| Axis Bank | 39.38% |
| ICICI Bank | 22.28% |
| HDFC Bank | 5.55% |
ICICI ranks first of seven on quality and second on size, but fifth on profit growth. That is the “quality at premium valuation” pattern: a strong franchise with mid-pack growth. For the slowest grower in the group, read our HDFC Bank stock analysis, and for a faster-growing peer, our Axis Bank analysis.
Technical view and model levels
The trend is strongly up but stretched. The price is about 12.6% above its 50-day average and 15.4% above its 200-day average. MACD is bullish, ADX is 39.3 (a strong trend), and the Parabolic SAR is bullish at ₹1,456.51.
The stretch is the concern. RSI is about 74 (overbought), Bollinger %B is 92.96, and the upper band sits at ₹1,604.49. On 11 November the stock opened at ₹1,616 but closed at ₹1,571.60, a reversal that hints at profit-taking near the high.
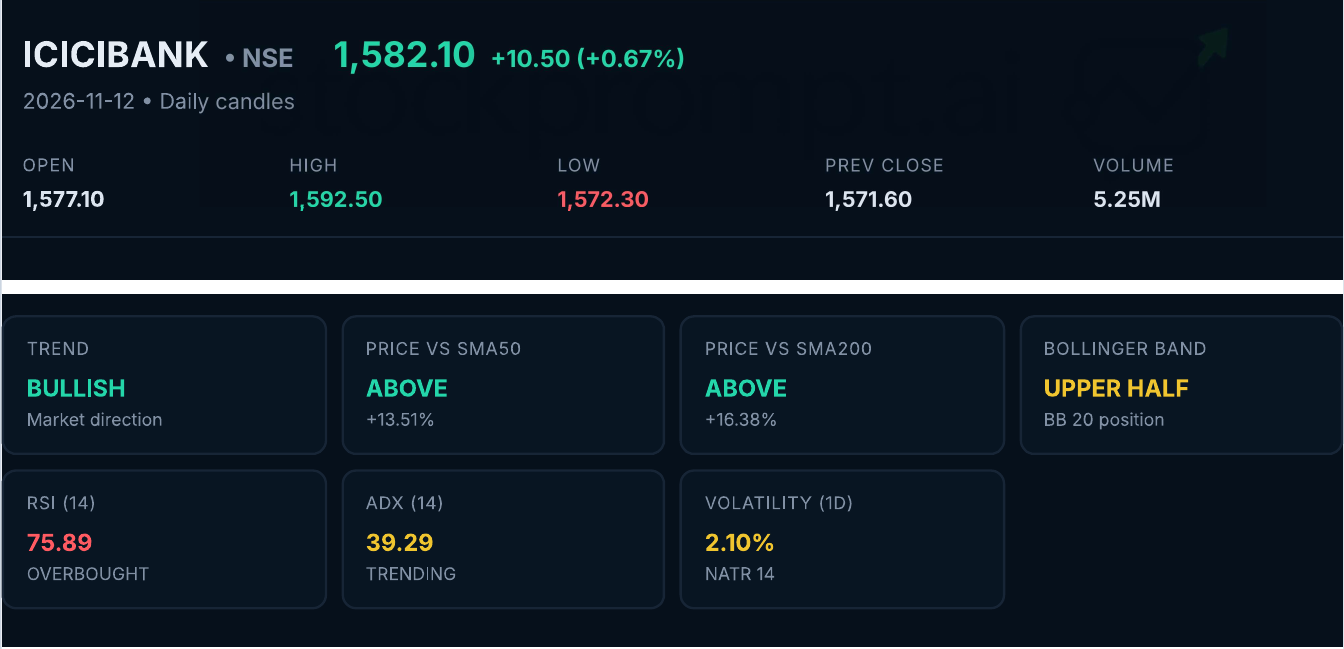
Technical indicator panel. Values can differ slightly from the figures quoted in the text. Source: StockPrompt.ai.
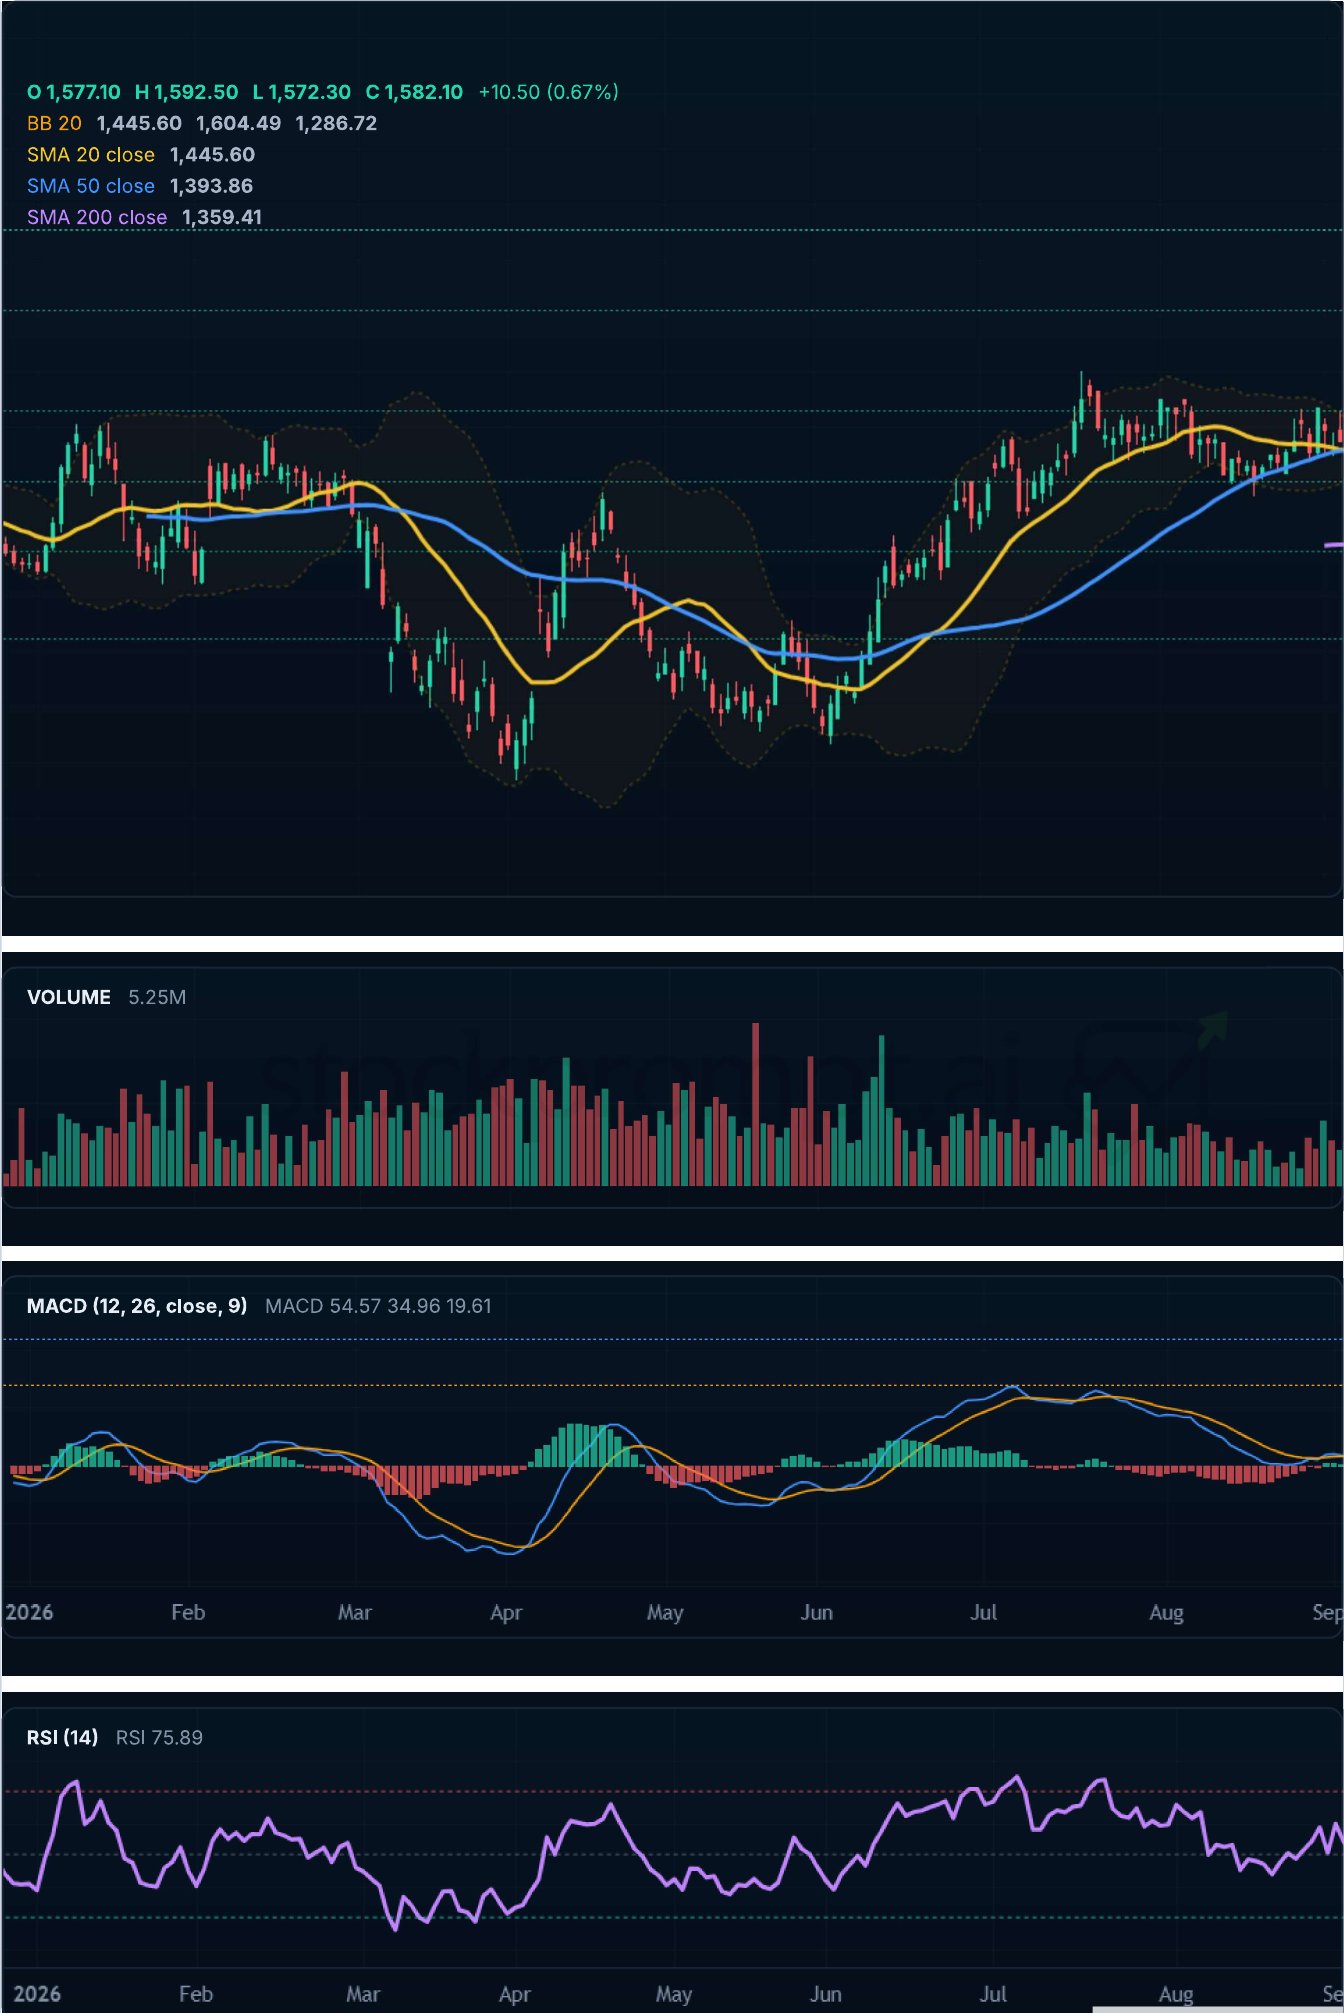
Daily price chart with moving averages, Bollinger Bands, MACD and RSI. Source: StockPrompt.ai.
Model levels for education (medium term, 2–3 months):
| Level | Price | vs CMP of ₹1,582.10 |
|---|---|---|
| Favourable zone | ₹1,542.69–₹1,568.96 | 0.83–2.49% below |
| Upside potential, base case | ₹1,647.78 | +4.15% |
| Upside potential, bull case | ₹1,680.62 | +6.23% |
| Risk level | ₹1,483.58 | −6.23% |
The bear scenario is ₹1,500, and near-term support is the 23.6% Fibonacci level at ₹1,498.59. Reward-to-risk at the current price is 0.67x (base) and 1.00x (bull). It improves to 1.27x and 1.73x near the favourable zone. The bull level is tactical upside, not a fair-value estimate, and these are model outputs for education.
Key risks and what to watch
Valuation is the largest risk. The rest are second-order but worth tracking:
- Margins: NIM was 4.18% in Q2, against 4.36% in Q1 and 4.30% a year ago. A tax-refund interest benefit was negligible, so watch whether it stabilises around 4.2%.
- Funding gap: loans grew 24.1% ex-FCNR(B) but deposits only 17%, which could raise funding costs.
- Asset quality: gross NPA additions were ₹4,833 Cr against recoveries of ₹3,620 Cr, a net ₹1,213 Cr. Watch for any reversal.
- Regulatory: a ₹1,283 Cr additional provision on the agricultural priority-sector book is held pending an RBI review. We found no other material unresolved action.
- Rates: hot US inflation has raised Fed-hike expectations, and US bond yields affect bank valuations.
Ownership is supportive. FII holding rose 0.89 percentage points to 34.68%, DII holding fell 0.55 points to 41.77%, and promoter pledge is 0%. Foreign investors were net buyers of ₹12,563 Cr on 11 November. The near-term score is 75/100 with a neutral bias, as strong sector earnings are offset by the stock’s reversal near its high.
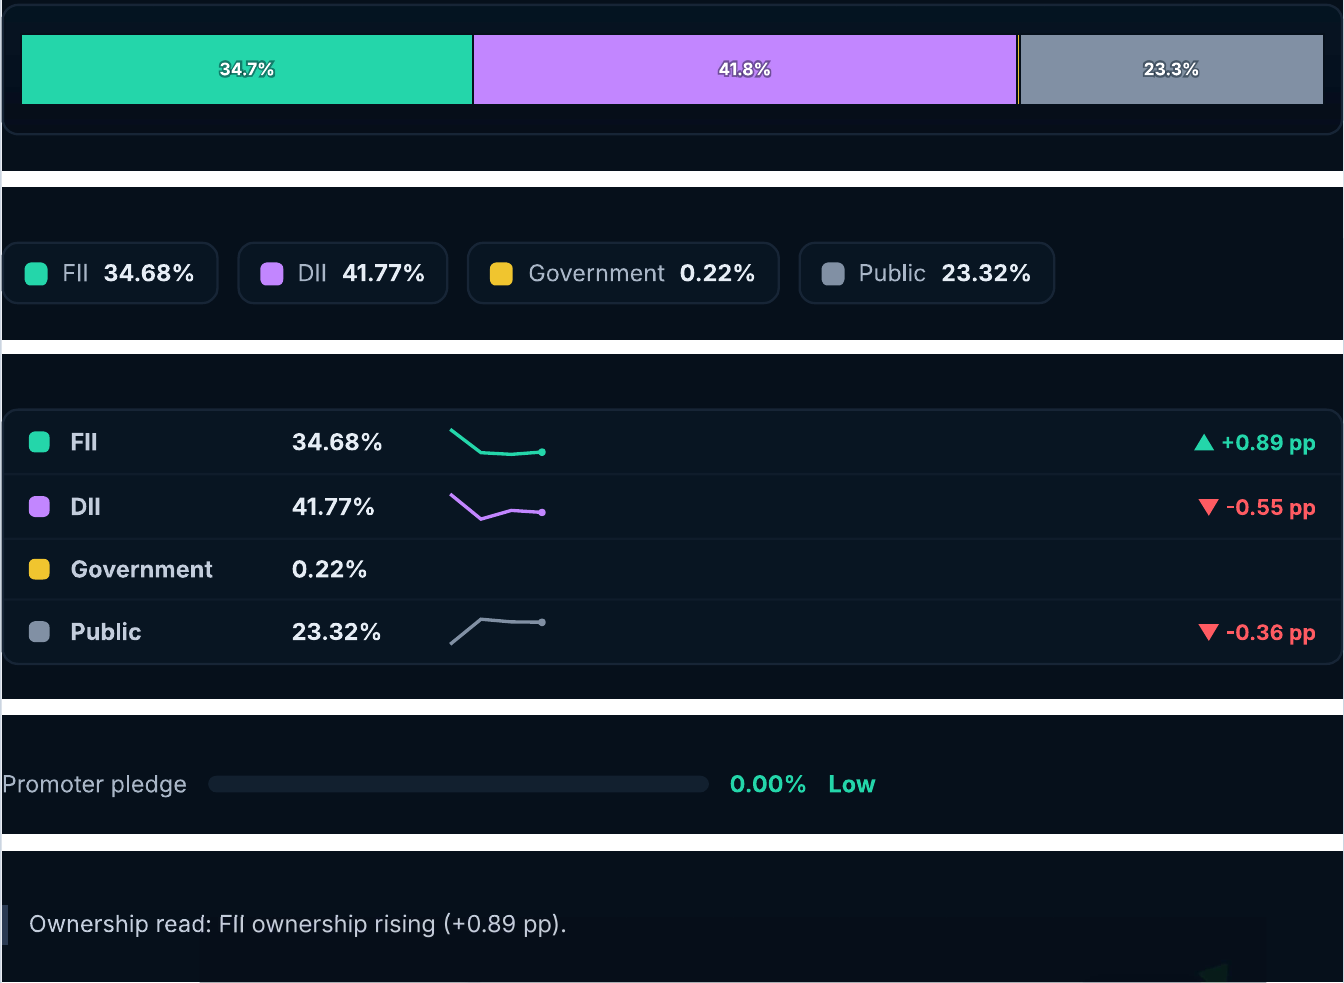
Shareholding as of September 2026. Source: StockPrompt.ai.
The takeaway: a quality franchise at a full price
ICICI Bank is a high-quality compounder, with 30% loan growth, 20% profit growth, a clean balance sheet and ample capital. The model’s question is not whether the bank is good but whether the price leaves room. With valuation scored 28/100 and RSI overbought, reward-to-risk is better near the model’s favourable zone than at the current price.
To test this on any NSE or BSE stock, run it through StockPrompt.ai and see factor scores, peer comparison and model levels in one report.
Try this on StockPrompt.ai
ICICI Bank Stock Analysis 2026: Is Its Strong Banking Franchise Still Worth a Premium?
Paste any NSE or BSE stock into StockPrompt.ai and ask the same question to get factor scores, peer comparison, model levels and risks in one report.
Frequently Asked Questions
Is ICICI Bank stock overvalued?
Our model scores valuation 28/100 and flags it as expensive. It trades at about 19.2x earnings against a 16.45x peer median, and 2.56x–2.93x book against 1.95x. Strong returns justify some premium, but not obviously a 50% one.
What is ICICI Bank’s gross NPA?
Gross NPA was 1.20% in September 2026, down from 1.58% a year earlier and 2.87% in March 2023. Net NPA is 0.30%, and provision coverage is 75% plus ₹13,100 Cr of contingency provisions.
What is ICICI Bank’s NIM?
Net interest margin was 4.18% in Q2 FY27, against 4.36% in Q1 and 4.30% a year earlier. It fell 18 basis points in one quarter, so margin stability is a key item to watch.
Disclaimer: This is AI-generated analysis for educational purposes only. AI can make mistakes, so verify data independently. It is not SEBI-registered investment advice. Please consult a SEBI-registered advisor before making investment decisions.
Sources: StockPrompt.ai analysis (12 Nov 2026 session), ICICI Bank Q2 FY27 results and earnings-call disclosures, exchange data, publicly available peer financials and market commentary as of 11–12 Nov 2026.