

Bajaj Finance has raised its FY27 AUM growth guidance to 26–27%, up from 22–24%, and that upgrade anchors this Bajaj Finserv share price analysis. Q2 FY27 profit after tax rose 25.4% to ₹5,952 Cr, yet General Insurance profit fell 18.8%. At ₹1,885.50 on 12 November 2026, the StockPrompt.ai model scores the stock 65/100 and labels it mildly bullish. The verdict in one line: the earnings engine looks ready, but the price already reflects much of it, with a thin 0.67x risk-reward.
Q2 FY27 results: lending leads, insurance lags
Bajaj Finance, the lending arm, drove the quarter, while the two insurance businesses pulled in opposite directions. Consolidated revenue was ₹43,416 Cr, up 16.7% year on year and 3.3% quarter on quarter. Profit after tax was ₹5,952 Cr, up 25.4% year on year but 5.5% below Q1’s ₹6,297 Cr.
Profit attributable to owners was ₹2,758 Cr, up 23%. Q2 also absorbed unrealised mark-to-market losses of ₹121 Cr in General Insurance and ₹56 Cr in Life. For the first half, revenue reached ₹85,453 Cr (+17.8%) and PAT ₹12,249 Cr (+21.6%). For wider earnings-season context beyond these Bajaj Finserv Q2 FY27 results, see our quarterly results blog.
| Pillar | Q2 FY27 datapoint |
|---|---|
| Bajaj Finance (lending) | AUM ₹5,84,624 Cr (+26%); PAT ₹6,367 Cr (+29%); ROA 4.6%; ROE 20.6% |
| Bajaj Housing Finance | AUM ₹1,58,205 Cr (+25%); PBT +18%; GNPA 0.29% |
| Bajaj General Insurance | GWP ₹7,056 Cr (+10%); PAT ₹420 Cr (₹517 Cr a year ago) |
| Bajaj Life Insurance | VNB ₹512 Cr (+39.6%); PAT ₹55 Cr (₹13 Cr a year ago) |
| Asset management | Q2 average AUM ₹37,842 Cr |
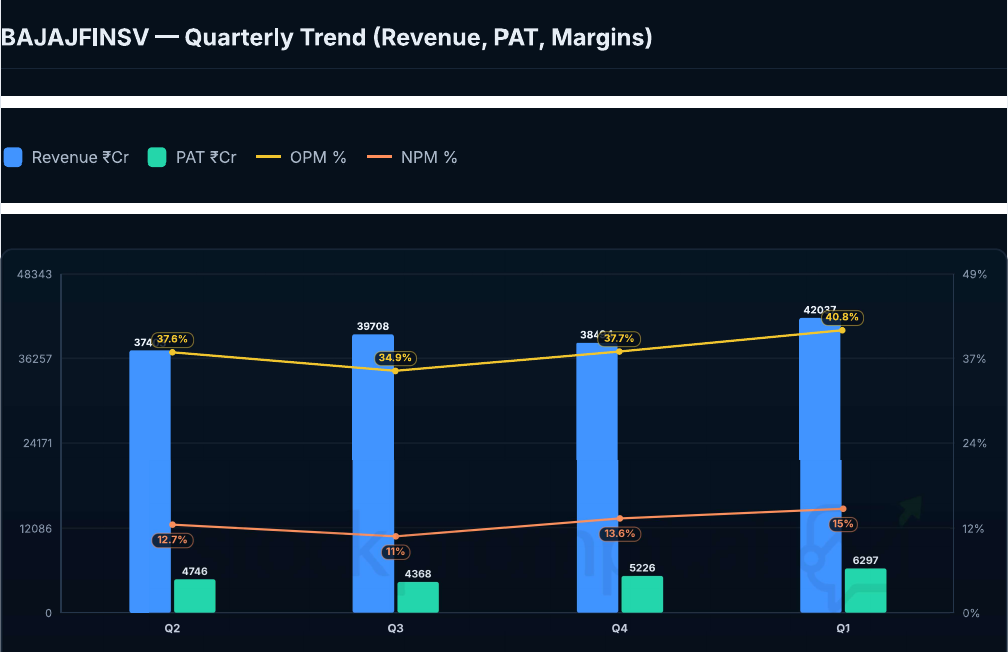
Quarterly revenue, PAT and margins. The last bar is Q1 FY27 (revenue ₹42,037 Cr, PAT ₹6,297 Cr, operating margin 40.8%).
Growth drivers behind the raised guidance
The upgrade rests on customers and capital, not on one strong quarter. Bajaj Finance guides 23–25% medium-term AUM growth and an ₹11 lakh crore AUM aspiration by FY30. Its franchise stands at 128.85 mn customers (+16% year on year), with 4.42 mn added in the quarter and 18–20 mn new customers planned in FY27.
Credit quality is improving. GNPA is 1.06% (1.24% a year ago) and NNPA is 0.42% (0.60%). Capital adequacy is 20.33%, with Tier-1 at 19.43%.
A capital raise of up to ₹17,500 Cr, through a QIP and promoter warrants, funds the faster growth and lowers the leverage corridor to 5.0–5.5x. Beyond lending, Life VNB is growing about 40% and the asset-management SIP book is up about 42%. Our Bajaj Finance share price analysis covers the lender in more detail.
Bajaj Finserv vs Bajaj Finance: Bajaj Finserv is the holding company of the lending, insurance and asset-management franchise, and Bajaj Finance drives most of the earnings.
The biggest weakness: General Insurance
General Insurance is the weakest link: profit fell 18.8% to ₹420 Cr as the combined ratio worsened to 104.5% from 102.3%. A ratio above 100% means underwriting loses money before investment income. The analysis attributes the slide to health-claim inflation and catastrophe losses, and rates it the highest-severity risk.
FY26 gross written premium rose 8.1% to ₹23,323 Cr, and market share slipped to 7.1% from 7.2%. Life is a partial offset, with VNB up 39.6%, though 13th-month persistency eased to 81% in FY26 from 82% in FY25.
Valuation against peers
At about 29.7x earnings, the market is already paying for continued compounding. P/E is 29.73x on trailing data and 28.01x on the latest quarterly data, P/B is 3.5x, EV/EBITDA is 11.5x and PEG is 1.68. The model classes the stock as “overvalued / valuation-constrained” and gives valuation a score of 47/100.
| Metric | Bajaj Finserv | Peer median | Gap |
|---|---|---|---|
| P/E | 28.0x | 14.3x | +96% |
| ROCE | 10.6% | 12.8% | −17% |
| Quarterly profit growth | +22.9% | 24.3% | Rank 4 of 7 |
Note: the analysis text cites a 16.6x median (a premium of about 69%), so the P/E premium is roughly 69–96%.
Quality ranks sixth of seven and size first. ROE of 13.2% and ROCE of 10.6% look low partly because they are measured on a consolidated holding structure that includes minority interests. The peers are mostly small holding companies and brokers, so treat the comparison as a rough guide.
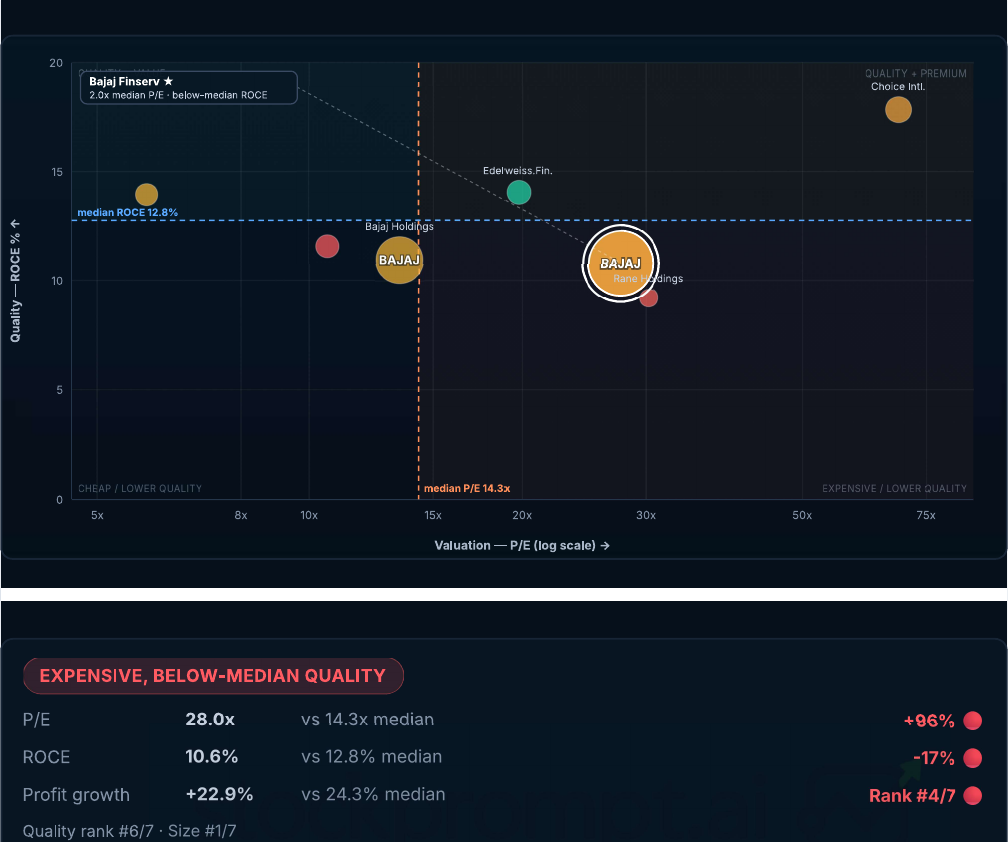
Peer positioning: valuation (P/E) against quality (ROCE), with bubble size showing market cap.
Technical view and model levels
The chart is bullish but stretched: the price sits near the upper Bollinger Band at ₹1,898.34, with %B at 95.9. This BAJAJFINSV technical analysis shows a gain of 2.20% (+₹40.50) on 12 November, against a previous close of ₹1,845.00, on volume of 981.05K. The price is 5.11% above the 50-day average of ₹1,793.85.
MACD is strongly bullish and ADX is 43.4. RSI is in the mid-to-high 60s (63 in the factor table, 68.32 on the chart), and the technicals score is 56/100. The analysis gives two readings of the 200-day average (about ₹1,847 on the chart panel, about ₹1,894 in the model summary), so the stock is effectively sitting near that long-term line. It trails the benchmark by 9.4% over 63 days.
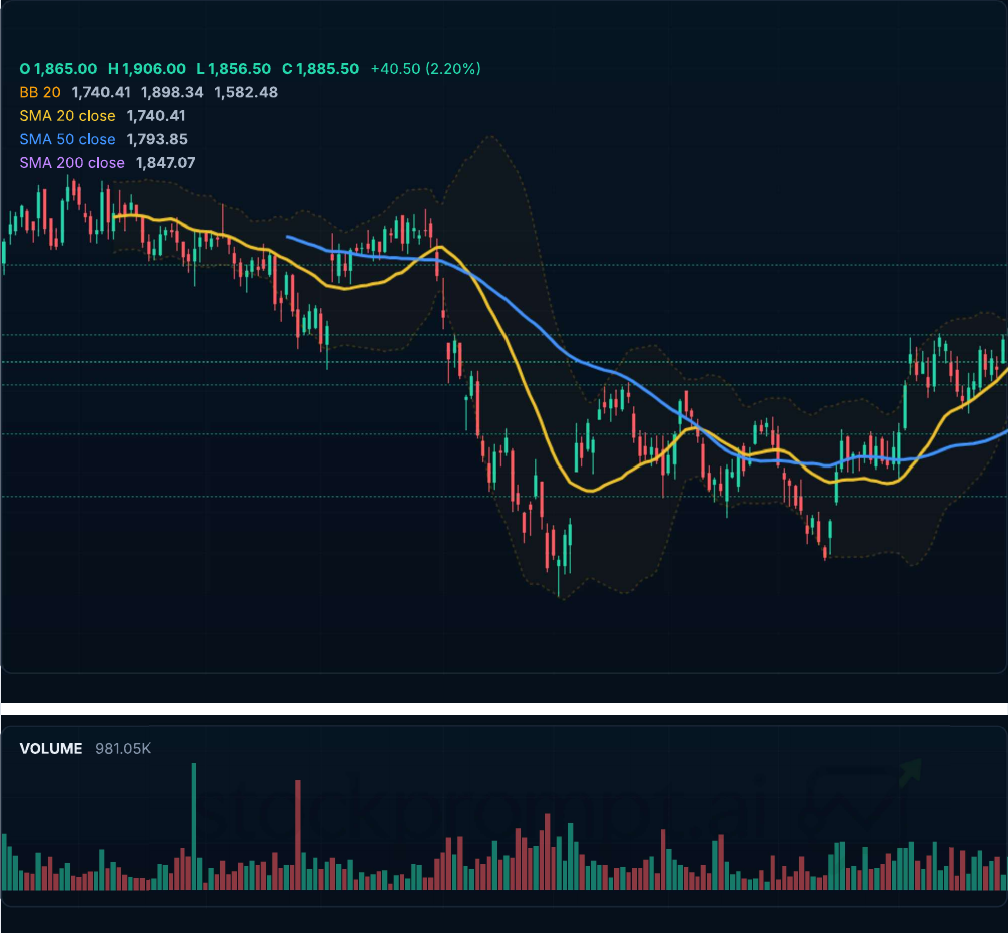
Daily candles with moving averages, Bollinger Bands and volume (12 November 2026).
Model levels for education (not advice). The horizon is the medium term, about 2–3 months, using a 63-day expected-move envelope.
| Model level | Value | Note |
|---|---|---|
| Resistance | ₹1,924.24 / ₹1,993.32 / ₹2,118.30 | 38.2% and 23.6% Fibonacci; 52-week high |
| Upside levels | ₹1,972.78 (+4.6%) / ₹2,016.42 (+6.9%) | Base / bull; bull is valuation-constrained |
| Support | ₹1,868.40 / ₹1,812.56 / ₹1,743.22 | 50% and 61.8% Fibonacci; trailing stop-and-reverse |
| Favourable zone | ₹1,833.13 – ₹1,868.04 | Model-computed zone nearer the supports |
| Risk level | ₹1,754.58 (−6.9%) | Bear scenario ₹1,776.40 |
| Risk-reward | 0.67x base, 1.00x bull at ₹1,885.50 | 1.27x base, 1.73x bull near the favourable zone |
Risks and what to watch
Four other risks are rated moderate:
- Dilution: the group is investing ₹5,800 Cr in Bajaj Finance warrants at ₹1,010 each, and the ₹11,700 Cr QIP (indicative ₹1,025, a 5% discount) adds up to 1.8% dilution.
- Cash flow: operating cash flow is negative (OCF/PAT −2.68x) and consolidated D/E is 5.52x. That is common for a lender growing its book, but it raises funding-cost sensitivity.
- Positioning: the stock sits near its upper band after lagging the benchmark, while the Nifty hit a nine-month high.
- Macro: Brent crude near $92 and unresolved US–Iran tensions.
The analysis found no material unresolved regulatory or legal action, though it could not independently confirm that none exists.
What to watch next:
- Bajaj Finance AUM growth against the 26–27% guidance, and its credit cost.
- QIP pricing and absorption.
- The General Insurance combined ratio against the 100% break-even mark.
- Life VNB growth and 13th-month persistency, plus the SIP book.
- Whether the stock closes above the 200-day average and nears the 52-week high of ₹2,118.30.
Ownership offers some comfort. Promoters hold 58.65% with 0% pledge, FII holding rose 1.26 pp to 8.16%, and DII holding fell 1.01 pp to 11.10% (Sep 2026).
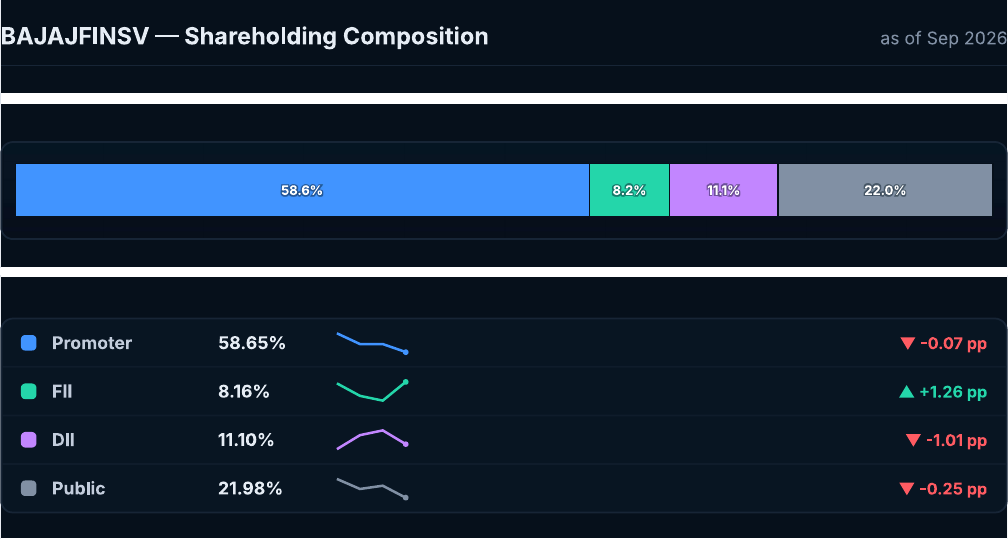
Shareholding composition as of Sep 2026, with change versus the prior period.
Conclusion
This Bajaj Finserv share price analysis comes down to one idea: a strong operating engine whose price has already absorbed most of the good news. The composite score is 65/100, with institutional (69) and risk (70) factors supportive and valuation (47) the drag. Whether the stock earns its premium depends on Bajaj Finance sustaining 26%+ AUM growth and the insurance arms recovering.
Want to test these levels yourself as the QIP prices? Run this Bajaj Finserv share price analysis on StockPrompt.ai, explore the features, compare the pricing plans, or sign up to start.
Try This on StockPrompt.ai
Bajaj Finserv Stock Analysis 2026: Is Its Financial Services Ecosystem Ready for Another Growth Cycle?
Frequently Asked Questions
Is Bajaj Finserv overvalued at the current price?
The StockPrompt.ai model flags it as valuation-constrained. P/E is about 29.7x (28.0x on the latest quarterly data), P/B is 3.5x and PEG is 1.68. The valuation score is 47/100.
What did Bajaj Finserv report in Q2 FY27?
Consolidated revenue was ₹43,416 Cr (+16.7%) and PAT ₹5,952 Cr (+25.4%). Bajaj Finance AUM grew 26%, while General Insurance profit fell 18.8%.
What is the difference between Bajaj Finserv and Bajaj Finance?
Bajaj Finserv is the holding company of a lending, insurance and asset-management franchise. Bajaj Finance, the lending arm, drives most of its earnings.
Disclaimer: This is AI-generated analysis for educational purposes only. AI can make mistakes, so always verify data independently. Model levels are for education and are not recommendations. This is not SEBI-registered investment advice. Please consult a SEBI-registered advisor before making investment decisions.
Sources: Company filings and Q2 FY27 investor presentations, exchange disclosures, publicly available peer financials, brokerage research notes and financial press, as compiled in the StockPrompt.ai analysis dated 12 November 2026.