

SBI Life’s value of new business (VNB) rose 19% to ₹32.7bn in H1 FY27, yet reported profit grew 17% and the shares trade at a trailing P/E of 69.93x. This SBI Life stock analysis 2026 uses StockPrompt.ai data as of 12 Nov 2026, 1:36 PM IST, with the share at ₹1,813.30. Verdict: operations are strong, but the rich valuation leaves little room for error, so the model gives a 60/100 score and a neutral, sideways bias.
Recent results: VNB up 19%, profit lagging
SBI Life’s H1 FY27 results, announced on 27 Oct 2026, showed VNB up 19% and annualised premium equivalent (APE) up 18%, with guidance maintained. Profit growth was slower, which is the central tension in the numbers.
| H1 FY27 metric | Value | Growth (YoY) |
|---|---|---|
| New business premium | ₹202.6bn | +10% |
| Gross written premium | ₹484bn | +13% |
| Renewal premium | ₹281.5bn | +15% |
| APE | ₹117.5bn | +18% |
| Individual APE | ₹97.7bn | +11% |
| VNB | ₹32.7bn | +19% |
| Profit after tax (PAT) | ₹12.7bn | +17% |
| Embedded value | ₹873.5bn | +15% |
VNB margin was 27.9% in H1 (27.8% a year earlier) and 29.3% in Q2. Q2 PAT was ₹5.5bn, up 11%, about 10% below brokerage estimates, although a 170 bps beat on VNB margin offset part of the disappointment.
GST-related costs explain much of the gap. The impact was ₹5.3bn in H1; excluding it, PAT would have been ₹16.9bn (+39%) and VNB ₹33.8bn. For earlier quarterly context, see our guide to reading insurers’ quarterly results.
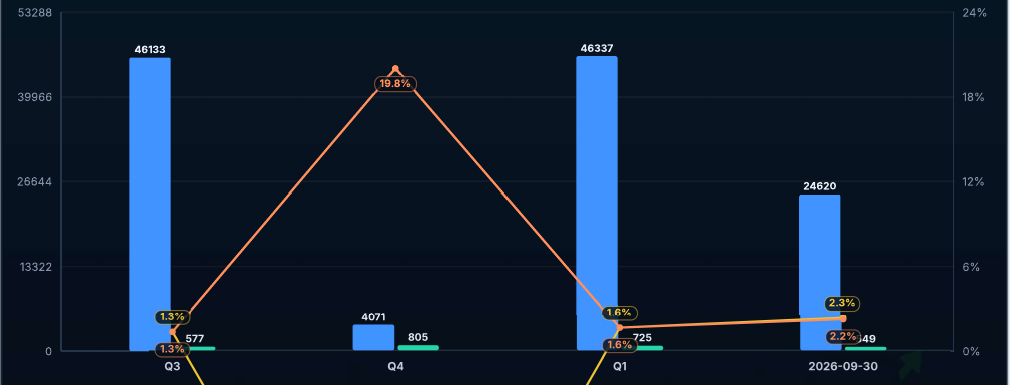
Quarterly trend chart (from the StockPrompt.ai analysis).
Reported PAT was ₹577 Cr in Q3 FY26, ₹805 Cr in Q4 FY26, ₹725 Cr in Q1 FY27 and ₹549 Cr in Q2 FY27. Quarterly revenue is lumpy for insurers because of investment gains and reserve movements, so VNB and APE are better indicators.
Growth drivers: protection and savings mix
Protection demand is the main engine. Management said protection is the largest growth contributor, and it held its FY27 guidance of 14–15% growth and a 26–28% VNB margin.
- Protection push: individual protection APE grew 16% in H1 FY27 (about 30% including riders). Group protection APE was ₹16bn, up 134%.
- Savings diversification: non-par savings rose 27% and annuity 28% in Q2 FY27, while ULIP share of APE fell to 56.0% from 57.8%.
- Awareness: individual and group new business sum assured grew 36% and 78% year-on-year in H1.
Scale and distribution support the story. Bancassurance is 60% of APE, the agency force is 2,82,001 strong, and there are 1,230 offices. SBI Life leads private-sector insurers in individual rated premium with a 22.6% share in H1 FY27.
| Sector KPI | Mar 2023 | Mar 2024 | Mar 2025 | Mar 2026 |
|---|---|---|---|---|
| APE (₹ bn) | 168.1 | 197.2 | 214.2 | 242.7 |
| 13th-month persistency | 85.5% | 86.8% | 87.4% | 87.9% |
| ULIP share of APE | 55.3% | 60.5% | 63.6% | 59.4% |
| Bancassurance share of APE | 64.4% | 61.8% | 61.3% | 60.0% |
| Agents | 2,08,774 | 2,46,078 | 2,40,304 | 2,82,001 |
APE grew at about a 13.0% CAGR over FY23–FY26. Capital looks comfortable too: solvency is 1.97x against the 1.50x requirement, and the company has no debt.
Retention quality is improving as well. 13th-month persistency was 87.9% in FY26, and 13th- and 49th-month persistency rose a further 44 bps and 40 bps in H1 FY27.
The biggest weakness: a stretched valuation
Valuation is the weak spot, and it is what holds the model score at 60/100. The valuation factor scores just 33/100, against 62 for fundamentals.
Earnings quality adds to the caution. Reported PAT rose 17% in H1 and 11% in Q2, below VNB growth of 19%, so accounting profit has not yet caught up with business momentum.
| Valuation metric | Reading |
|---|---|
| P/E (live price) | 69.93x (60th percentile of peers) |
| P/B | 8.22x (80th percentile) |
| PEG | 4.95 |
| EPS | ₹25.93 |
| P/EV (H1 FY27 EV ₹873.5bn) | About 1.89x |
| Dividend yield | 0.16% |
There is a counter-argument. The model’s fair-value anchor rates the stock “fairly valued”, and high P/E and P/B ratios are typical of life insurers because accounting earnings lag VNB and embedded value. P/EV is arguably the fairer lens.
Valuation versus peers
SBI Life trades at a premium to peers on book value. Peer rows were not returned in this run, so the comparison rests on percentile placement: 60th on P/E and 80th on P/B among life insurers. The P/E placement suggests the multiple is not extreme against that group, but the P/B placement shows investors pay up for book value.
Peers are improving too. Bajaj Life’s VNB margin expanded 460 bps to 21.7%, and it reported a Q2 VNB rise of 40%. For side-by-side reads, see our HDFC Life analysis and ICICI Prudential Life analysis.
Technical view and model levels
The share is short-term extended after a strong session. It closed at ₹1,813.30 (+2.62%) on 12 Nov 2026, between a day low of ₹1,756.20 and a high of ₹1,820.00, and sits 16.30% below its 52-week high of ₹2,109.60.
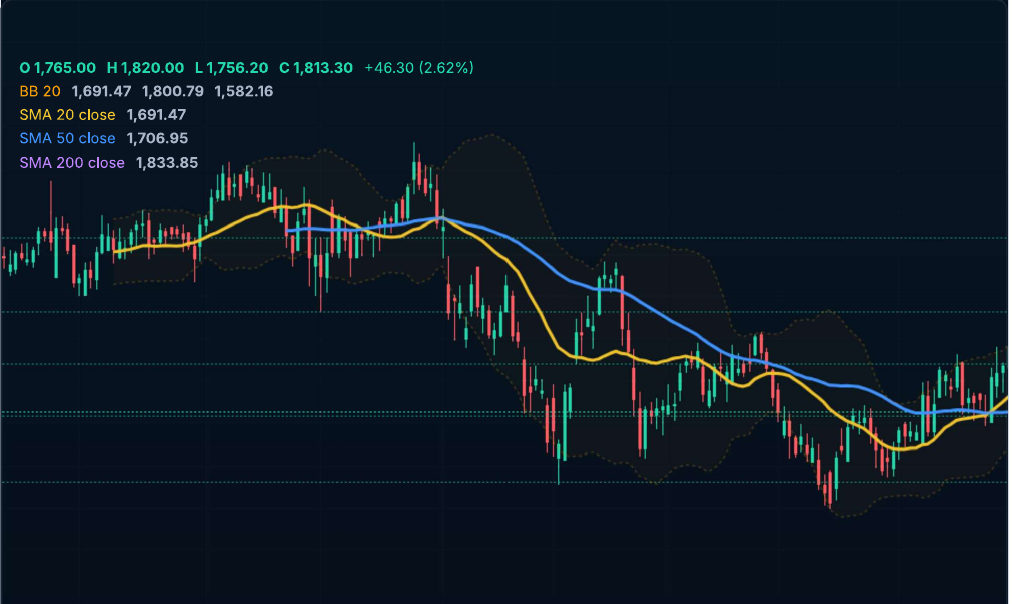
Price chart with moving averages and Bollinger Bands.
The price is above the 50-DMA but below the 200-DMA, and 126-day relative strength is −10.2% against the benchmark. RSI readings vary between about 62 and 68 across the report’s panels, MACD is bullish and ADX is 30.8, which signals a trend. The price is above the upper Bollinger Band (₹1,800.79), Fibonacci 61.8% sits at ₹1,815.06, and Parabolic SAR is bullish at ₹1,675.64.
The model-computed levels below are for education only, over a medium-term horizon of 2–4 months.
| Model level (education only) | Value |
|---|---|
| Favourable zone | ₹1,762.85–₹1,796.48 |
| Base upside level | ₹1,897.38 (+4.64%) |
| Bull upside level | ₹1,939.42 (+6.96%) |
| Risk level | ₹1,687.18 (−6.96%) |
| Bear scenario level | ₹1,708.20 |
| Reward-to-risk at current price | 0.67:1 base, 1.00:1 bull |
| Reward-to-risk near favourable zone | 1.27:1 base, 1.73:1 bull |
At the current price, reward-to-risk is thin. The model’s near-term score for the coming session is 58/100, as Wall Street fell on 10 Nov on hot US inflation and Fed-hike fears.
Read together, the signals are mixed rather than weak. Trend indicators are constructive, but the stretched SBI Life share price and thin reward-to-risk call for patience in this SBI Life stock analysis 2026.
Risks and what to watch
The risks centre on how much the share price already assumes. Any VNB miss could hit the price at a P/E of 69.93x.
- GST impact: reported PAT was cut by ₹5.3bn in H1 and VNB margin by about 90 bps.
- Channel dependence: bancassurance is about 60% of APE, and agency growth is expected to normalise.
- Market sensitivity: a ULIP-heavy mix (59.4% of APE in FY26) ties volumes to equity markets.
- Regulation: searches found no material SEBI, IRDAI or litigation overhang, but insurance rules can change quickly, as GST did.
Ownership looks stable. Promoters hold 55.31% with no pledge, FIIs 20.68% (−0.27 pp) and DIIs 20.05% (+0.38 pp) as of Sep 2026.
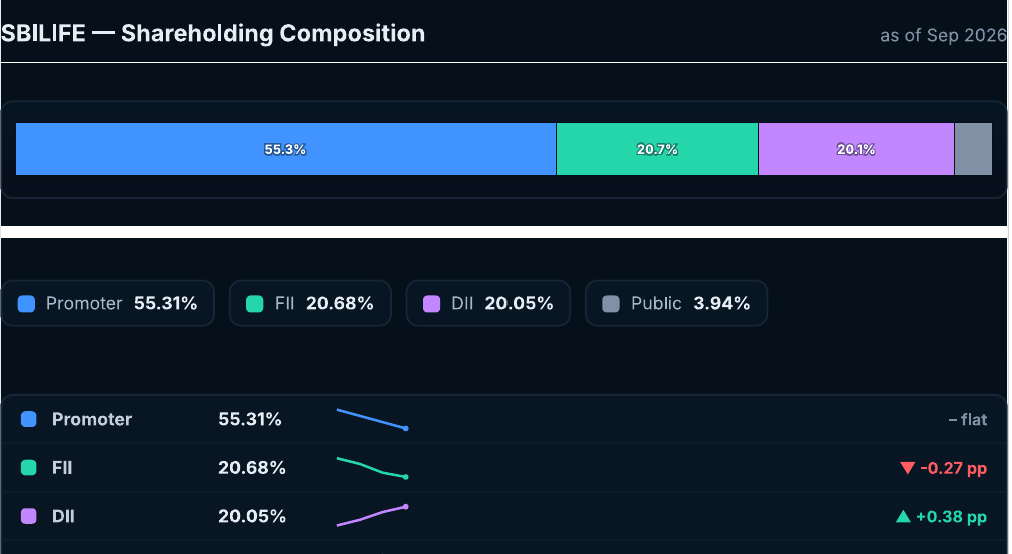
Shareholding composition, Sep 2026.
Key monitorables:
- VNB margin against the 26–28% guidance band, and the gap between reported and ex-GST margin.
- Full-year APE and individual rated premium growth against the 14–15% guidance. Q2 was subdued.
- Protection mix and rider attachment, plus ULIP share as new traditional products launch.
- 13th- and 49th-month persistency, and Q3 FY27 PAT recovery as the GST drag works through.
Conclusion
SBI Life is a story of strong operations priced for near-perfection. Protection and savings demand are lifting VNB, but the P/E of 69.93x and thin reward-to-risk explain the 60/100 score and sideways bias. For investors, the question is whether VNB growth can outrun the valuation. The next checkpoint in this SBI Life stock analysis 2026 is Q3 FY27, when the GST drag on PAT should show whether earnings are catching up. Track the quarterly results and run your own checks with StockPrompt.ai’s research features. You can see pricing or sign up to try it on any NSE or BSE stock.
Try This on StockPrompt.ai
Paste this prompt into StockPrompt.ai to generate your own report:
SBI Life Stock Analysis 2026: Can Protection and Savings Demand Boost Its Earnings?
Frequently Asked Questions
Is SBI Life’s valuation high?
In our SBI Life stock analysis 2026, P/E (69.93x) and P/B (8.22x) screen expensive, and the model scores valuation 33/100. On P/EV it is about 1.89x, and the model’s fair-value anchor calls it “fairly valued”.
What is SBI Life’s VNB margin in FY27?
VNB margin was 27.9% in H1 FY27 against 27.8% a year earlier, and 29.3% in Q2. Management guidance is 26–28% for FY27.
What are the model levels for SBI Life?
For education only, the model’s favourable zone is ₹1,762.85–₹1,796.48, with a risk level of ₹1,687.18 and base and bull upside levels of ₹1,897.38 and ₹1,939.42.
Disclaimer: This is AI-generated analysis for educational purposes only. AI can make mistakes, so verify all data independently. It is not SEBI-registered investment advice. Consult a SEBI-registered advisor before making investment decisions.
Sources: Company filings and Q2 FY27 earnings call, press releases, brokerage sector commentary, exchange and market data, and StockPrompt.ai model analytics (data as of 12 Nov 2026, 1:36 PM IST).