

Shriram Finance reported Q2 FY27 profit after tax of ₹3,677 Cr, up 59.37% year on year, helped by a net interest margin of 9.52%. Yet management cut its AUM growth guidance to 15–17% from 18%. This Shriram Finance share price analysis asks how much of the jump will last. At ₹999.40 on 12 November 2026, the StockPrompt.ai model scores the stock 60/100 (mildly bullish to neutral-to-positive). The verdict: strong earnings, but a 21% rally in two weeks leaves risk-reward thin at 0.68x.
Q2 FY27 results: a margin-led jump
A fatter margin and fresh MUFG capital drove the quarter more than volume did. PAT was ₹3,677 Cr, up 59.37% year on year and 6.5% on Q1’s ₹3,453 Cr. Net interest income rose 38.2% to ₹8,661 Cr, while AUM grew a more modest 16.96% to ₹3,29,022 Cr.
Disbursements rose 25.71% to ₹54,079 Cr. EPS grew less than profit, up 27.4% to ₹15.63, because equity rose from ₹65,705 Cr in March 2026 to ₹1,11,206 Cr in September 2026 after the MUFG share issue. Management expects the margin boost to fade over time. For wider earnings coverage beyond these Shriram Finance Q2 FY27 results, see our quarterly results blog.
| Metric | Q2 FY27 | Q2 FY26 |
|---|---|---|
| Net interest margin | 9.52% | 8.19% |
| Gross / net Stage 3 | 4.65% / 2.31% | 4.57% / 2.49% |
| Credit cost (on assets) | 2.03% | 1.68% |
| Capital adequacy | 33.24% | 20.68% |
| Debt/equity | 2.12x | 3.88x |
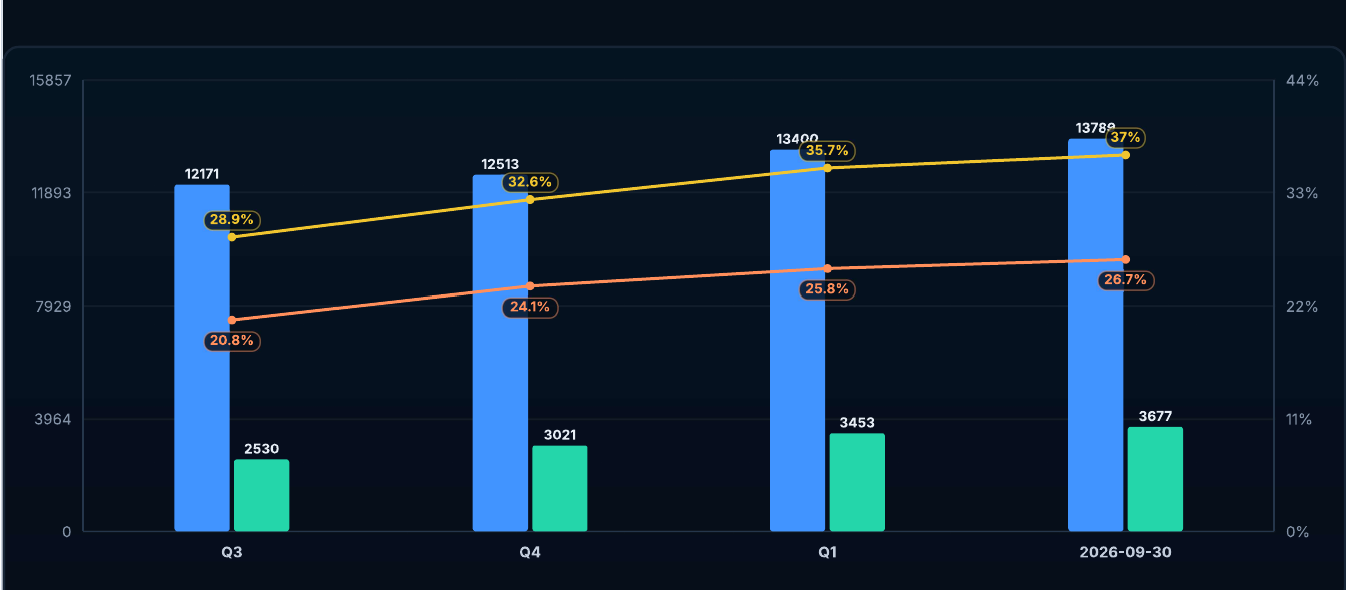
Quarterly revenue (₹12,171 Cr to ₹13,789 Cr), PAT (₹2,530 Cr to ₹3,677 Cr) and margins, four quarters to 30 Sep 2026.
Growth drivers: rural reach and new products
Rural reach is the franchise’s main lever: ₹1,94,810 Cr, or 59.2% of AUM, sits in rural and semi-urban India. Of 3,225 branches, 2,043 are semi-urban or rural, and the company serves 10.57 million customers. A normal monsoon and better farm incomes would lift both volumes and asset quality.
The product mix is widening. New-vehicle financing has risen to 16% of disbursements from 10%, and the company aims for 20–25% over 2–3 years. The gold-loan book is planned to double from about 2.5% to 5% of AUM over three years, and MSME lending is expected to outgrow the book.
Funding helps too. The company holds a CARE AAA rating, and 10-year government bond yields fell 11 bps on 5 November, the biggest drop in seven months. Motilal Oswal estimates an 18% sector AUM CAGR over FY26–28, and MUFG put in ₹39,618 Cr at ₹840.93 a share for about 20% of the company. Compare lenders in our Bajaj Finance share price analysis and Cholamandalam analysis.
The biggest weakness: credit cost and rural stress
Credit cost is the weak spot: FY27 guidance is now about 2.3–2.4%, against 2.03% in Q2 and 1.68% a year earlier. Stage 3 stands at 4.65%, provision coverage is 51.48%, and gold-loan asset quality is a concern. The shares fell as much as 6.34% to ₹810.20 on 26 October after the results, despite a profit beat.
Rural stress could add to it. Monsoon rainfall is about 12% below the long-period average, and drought-like conditions have been reported in Maharashtra and Bihar. Credit cost could stay elevated for one to three more quarters, and some analysts said FY27 may miss the 2% guidance.
Margins add a second squeeze. NIM of 9.52% is expected to ease to about 9% in the medium term and about 8.5% in the long term.
Valuation against peers
Our Shriram Finance share price analysis finds the stock cheap on book value but only 35/100 on the model’s valuation score. P/E is 17.69x on the live price and CMP/BV is 2.15x (latest book ₹473.58), the lowest in its peer set, where the range is 2.41x–5.57x. The model’s P/B of 2.64x uses the pre-MUFG book value, so the post-MUFG picture looks better.
| Metric | Shriram Finance | Peer median | Gap |
|---|---|---|---|
| P/E | 18.6x | 19.0x | −2% |
| ROCE | 11.5% | 9.9% | +16% |
| Quarterly profit growth | +59.2% | 37.4% | Rank 2 of 7 |
Quality ranks second of seven and size second. The model rates the stock “undervalued” on fundamentals, yet the multiple is hard to stretch: credit cost is rising, growth guidance is lower and margins should normalise. After Q2, 38 of 41 analysts held positive ratings, though that sits outside the model score.
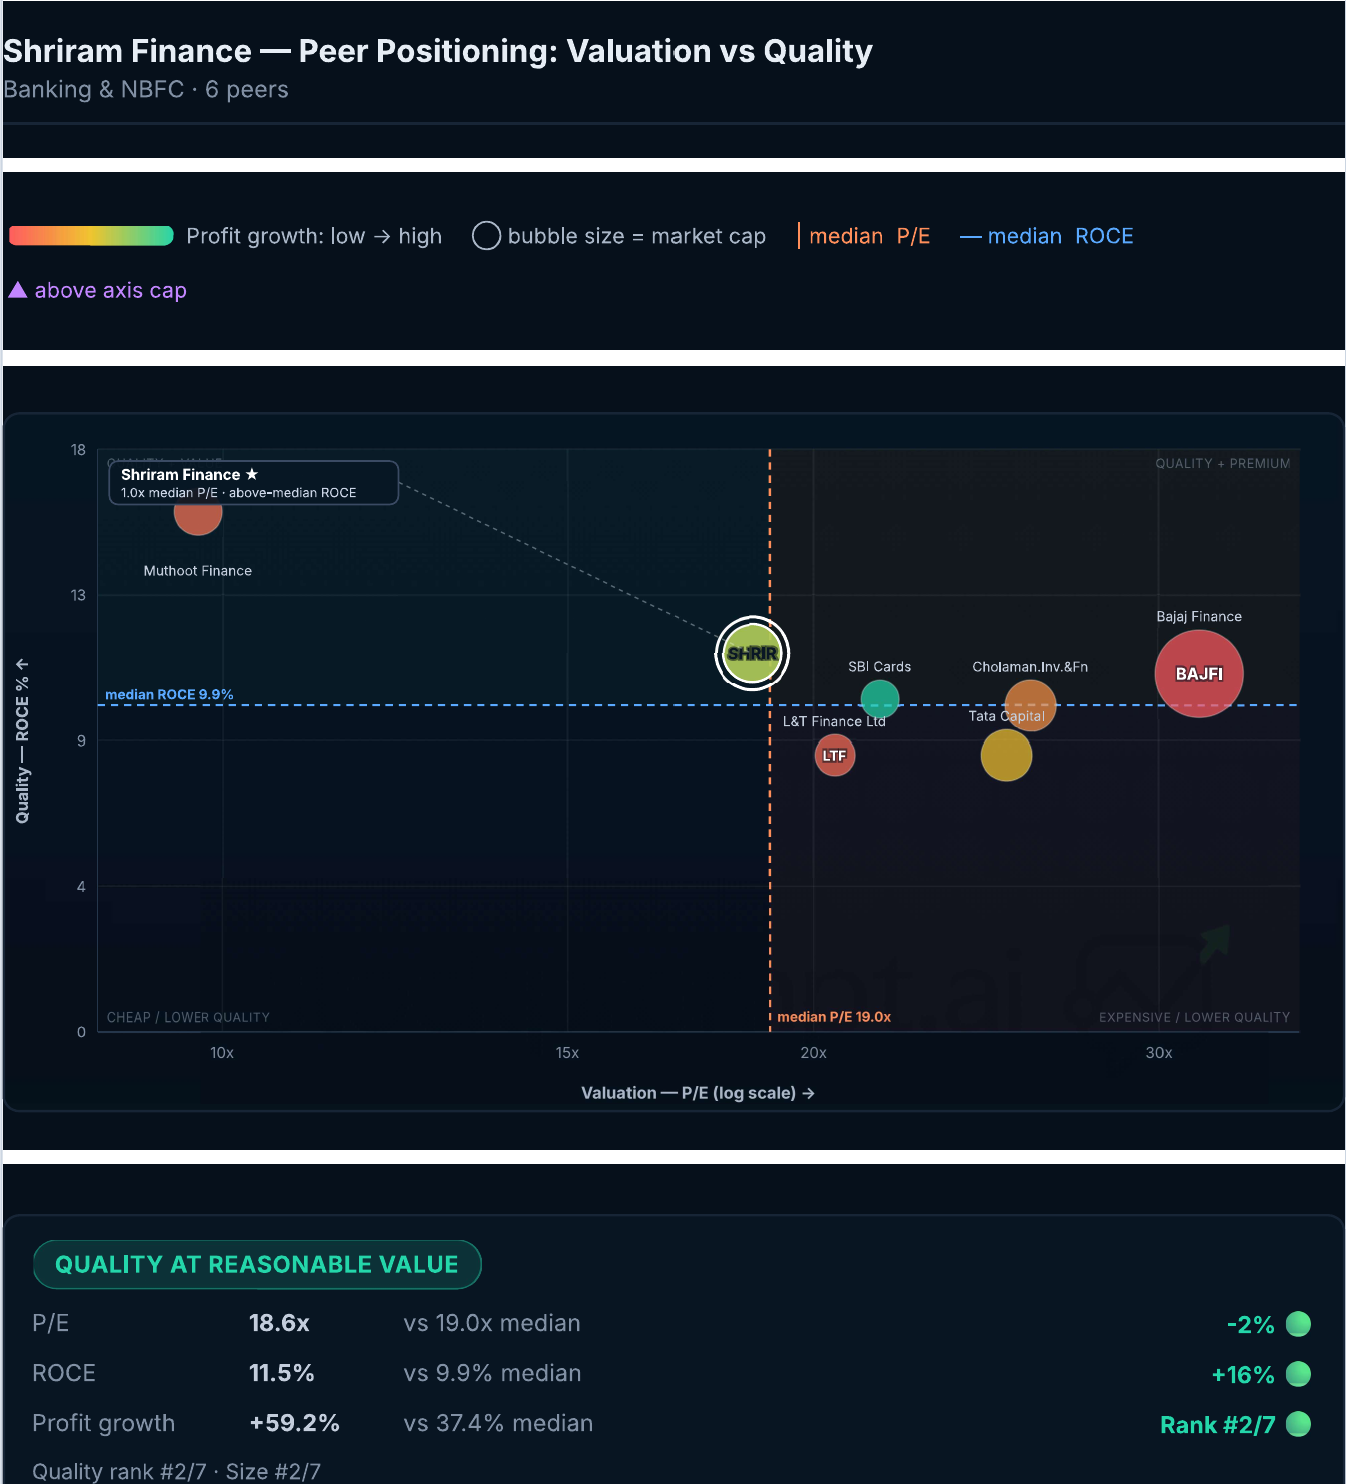
Peer positioning: valuation (P/E) against quality (ROCE), bubble size showing market cap. P/E of 18.6x here differs from the 17.69x live figure.
Technical view and model levels
Price has recovered above the 50-day average but sits just under the 200-day line, the immediate resistance zone. This SHRIRAMFIN technical analysis shows ₹999.40 (+3.12%) on 12 November, from an open of ₹972.00, a high of ₹1,006.00 and volume of 4.34M. The stock is 4.29% above its 50-day average of ₹958.33 and 0.15% below the 200-day average of ₹1,000.94.
RSI is 63.90 on the chart (58.3 in the factor table) and ADX is 33.4, signalling a trending move. The stock has rallied about 21% since ₹823.60 on 27 October, and the technicals score is 56/100. It sits 12.4% below its 52-week high of ₹1,141.
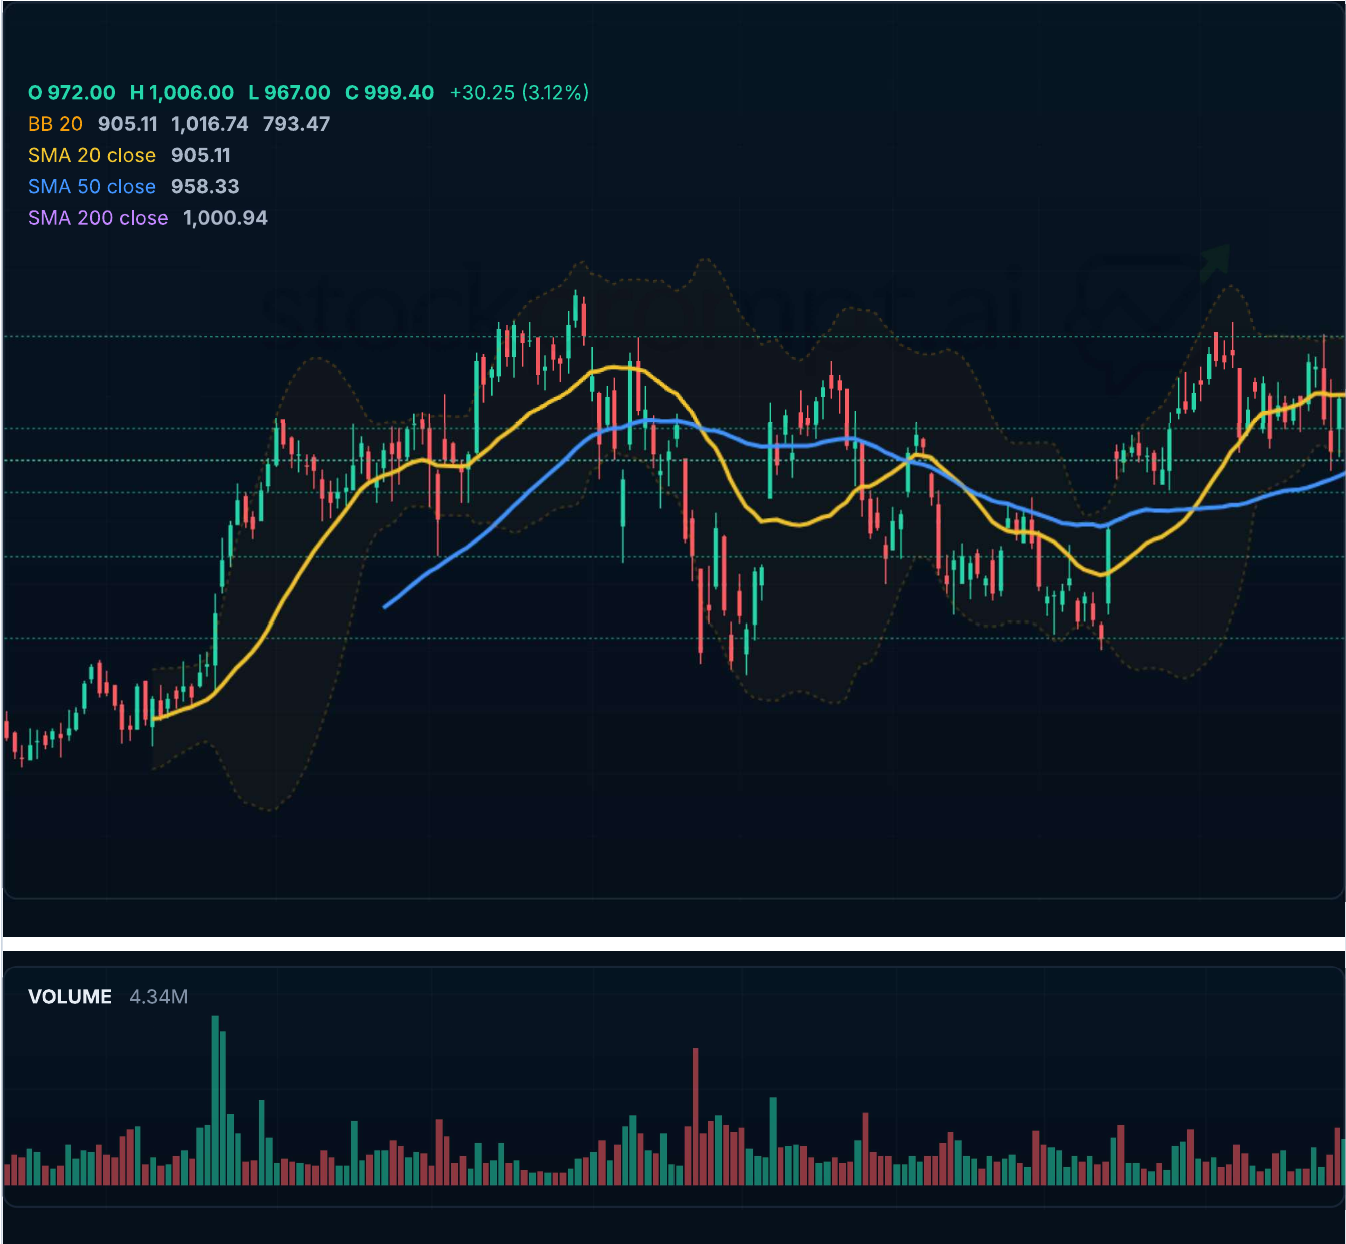
Daily candles with moving averages, Bollinger Bands and volume (12 November 2026).
Model levels for education (not advice). Horizon: medium term, 2–4 months.
| Model level | Value | Note |
|---|---|---|
| Resistance | ₹1,001 / ₹1,014.29 / ₹1,141 | 200-day average; 38.2% Fibonacci; 52-week high |
| Upside levels | ₹1,061.86 / ₹1,093.10 | Base (about 6.2% above price) / bull |
| Favourable zone | ₹961.92 – ₹986.91 | Model-computed; price is above it |
| Risk level | ₹907.95 | About 9% below price; bear case ₹921.32 |
| Risk-reward | 0.68x base, 1.02x bull at ₹999.40 | 1.32x base, 1.79x bull near the zone |
Risks and what to watch
Beyond credit cost and rural stress, the analysis flags these:
- Margin normalisation: part of today’s earnings growth comes from deploying the MUFG capital.
- Cash flow: free cash outflow of ₹13,475 Cr, interest cover of 1.7x and OCF/PAT of −1.17x. This is typical of a fast-growing lender but still a funding dependency.
- Macro: West Asia tensions, crude near $92, and a sharp short-term rally.
- Sector supply: Bajaj Finance’s ₹11,700 Cr QIP adds equity supply to the sector.
The analysis found no material unresolved regulatory or legal overhang.
What to watch next:
- Credit cost against the temporarily raised 2.3–2.4%, and whether Stage 2 and Stage 3 stabilise.
- Rainfall and rabi sowing, especially in Maharashtra and Bihar.
- NIM drift from 9.52% toward 9%, and AUM growth within the 15–17% guidance.
- Gold-loan asset quality, bond yields and funding cost.
Ownership shifted sharply as of Jun 2026: FII holding rose 9.60 pp to 54.75%, promoters fell 5.08 pp to 20.30% and DIIs fell 3.39 pp to 19.90%. Promoter pledge is 0%.
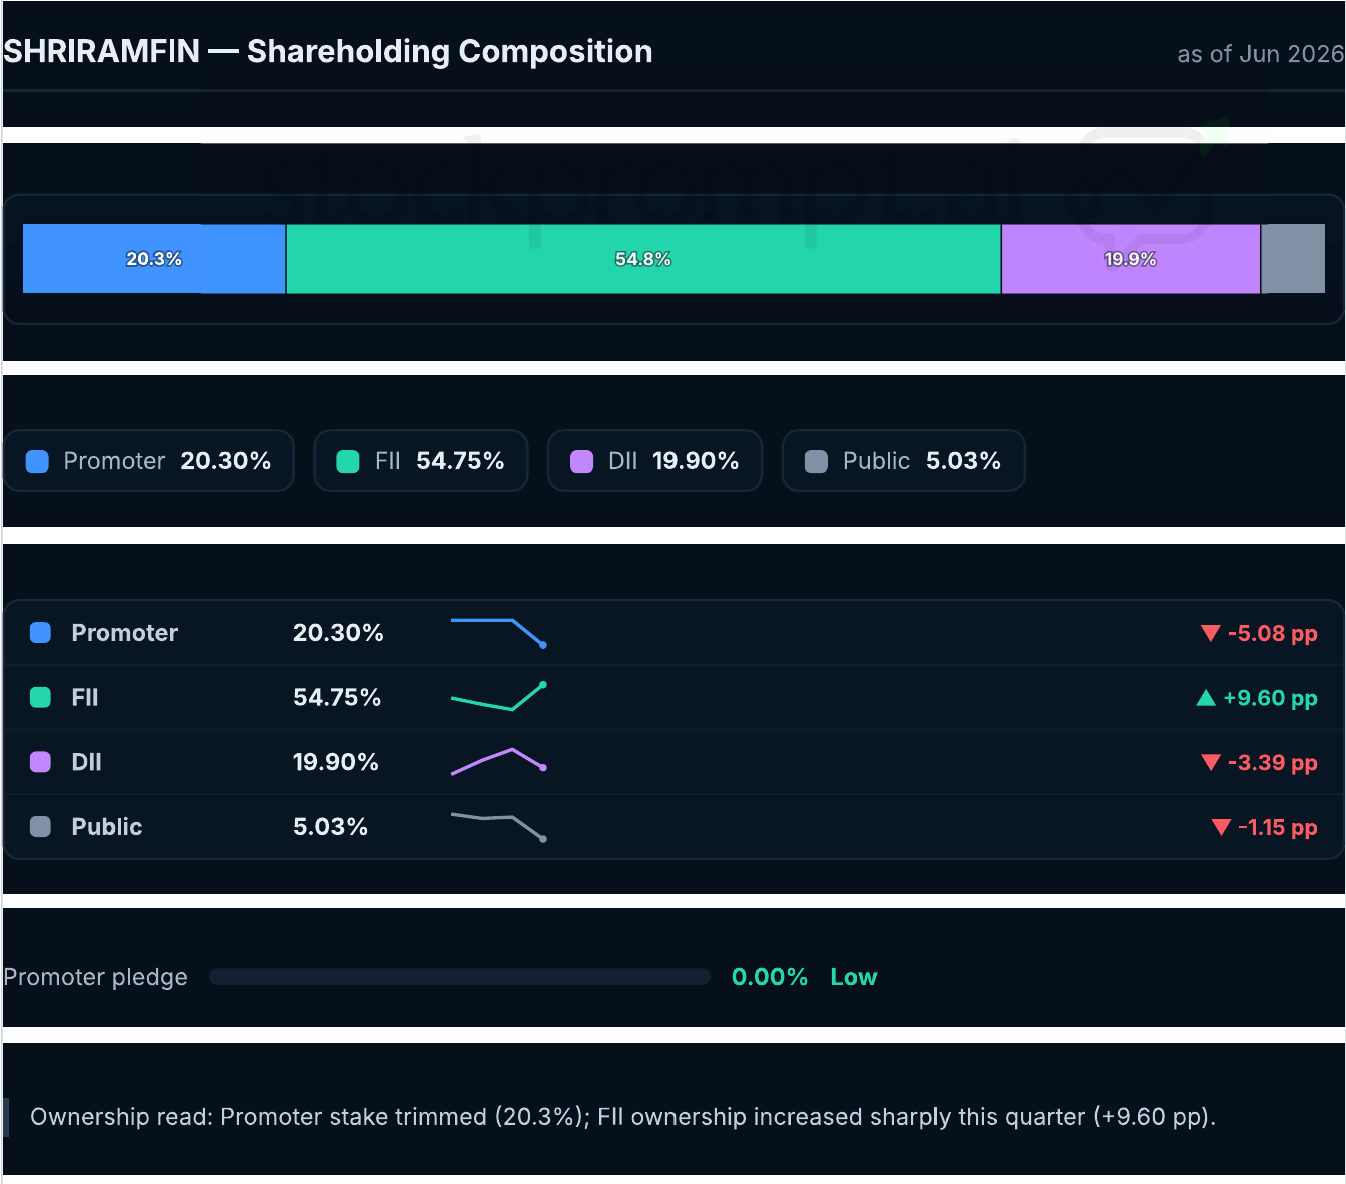
Shareholding composition as of Jun 2026, with change versus the prior period.
Conclusion
The Q2 jump is real, but the next leg depends less on margin and more on rainfall and credit cost. The composite score is 60/100: fundamentals 85, risk 67, institutional 60, technicals 56 and valuation 35, adjusted by −3 for the guidance cut and stale pre-MUFG leverage inputs. The near-term score of 63 is neutral.
Curious how the levels shift if credit cost moves? Rerun this Shriram Finance share price analysis on StockPrompt.ai, browse the research features, or create an account to start.
Try This on StockPrompt.ai
Shriram Finance Stock Analysis 2026: Can Rural Credit Demand Fuel Its Next Growth Story?
Frequently Asked Questions
Is Shriram Finance cheap or expensive at the current price?
P/E is 17.69x and CMP/BV is 2.15x, the lowest among its peers (2.41x–5.57x). The model still scores valuation 35/100 because credit cost is rising and margins should ease from 9.52%.
Why did Shriram Finance’s profit jump 59% in Q2 FY27?
PAT rose 59.37% to ₹3,677 Cr on a 9.52% net interest margin (8.19% a year earlier) and 38.2% higher net interest income. MUFG-funded capital also helped, and management expects the boost to fade.
How much of Shriram Finance’s loan book is rural?
About 59.2% of AUM, or ₹1,94,810 Cr, sits in rural and semi-urban India. Of its 3,225 branches, 2,043 are semi-urban or rural.
Disclaimer: This is AI-generated analysis for educational purposes only. AI can make mistakes, so always verify data independently. Model levels are for education and are not recommendations. This is not SEBI-registered investment advice. Please consult a SEBI-registered advisor before making investment decisions.
Sources: Company Q2 FY27 earnings call and investor presentation, exchange filings, brokerage commentary, market reports and publicly available peer financials, as compiled in the StockPrompt.ai analysis dated 12 November 2026.