

HCLTech posted its highest-ever quarterly net income of ₹5,132 Cr in Q2 FY27, up 21.2% year on year, yet constant-currency (CC) revenue grew only 2.6%. This HCLTech stock analysis, using data as of 16 November 2026, asks whether margin repair can carry the shares. StockPrompt.ai scores the stock 70/100 at ₹1,383.40 with a mildly bullish verdict: the margin recovery and deal momentum are real, but risk-reward is unfavourable at the current price and a rerating needs faster top-line growth.
Recent results: record profit, modest growth
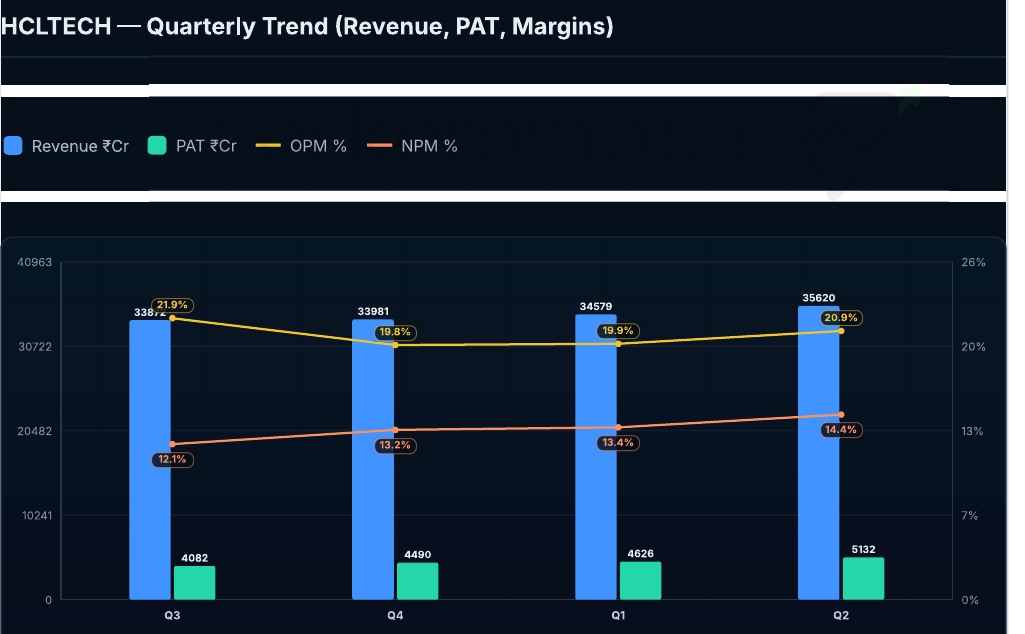
Q2 FY27 delivered record profit on a recovering margin, but revenue growth stayed modest. Revenue was ₹35,620 Cr, up 3.0% QoQ, and net profit was ₹5,132 Cr, up 10.9% QoQ and 21.2% YoY.
| Q2 FY27 metric | Value | Change |
|---|---|---|
| Revenue | ₹35,620 Cr | +3.0% QoQ |
| Net profit | ₹5,132 Cr | +10.9% QoQ, +21.2% YoY |
| EBIT margin | 18.2% | +131 bps QoQ, +71 bps YoY |
| EBIT margin ex-restructuring (computed) | about 19.0% | 84 bps one-off |
| Services EBIT margin | 18.0% | +123 bps QoQ |
| Revenue growth YoY (INR / USD / CC) | 11.5% / 2.2% / 2.6% | – |
| FY27 guidance is for CC revenue growth of 2.5–4.0% (Services 3.0–4.0%) and an EBIT margin of 17.5–18.5%. An interim dividend of ₹12 per share was also announced. To read results like these with more confidence, see our guide to quarterly results analysis. | ||
 |
||
| Quarterly revenue and PAT. The chart’s operating margin (20.9%) is a different measure from the 18.2% EBIT margin quoted above. |
Growth drivers: AI revenue and record bookings
Advanced AI revenue and deal flow are the strongest parts of the story. Advanced AI revenue was $219M in Q2 (annualised $876M), up 28.4% QoQ and 78.0% YoY in CC, which is about 5.9% of quarterly revenue.
- Bookings: Q2 bookings were $3.26B, up 27% YoY, and H1 bookings were a record. Wins span AI-led IT operations, SAP S/4HANA managed services and VisionX AI inspection.
- Partnerships: a Global Premier Partnership with Anthropic for agentic AI, plus an AI Factory win with a US AI-native company.
- Diversified mix: IT & Business Services, Engineering & R&D and HCLSoftware, whose ARR was $1,045M in March 2026.
- Scaled-vendor tailwinds: vendor consolidation and GCC set-ups in India, such as WACKER, favour scaled players.
- Currency: a rupee near ₹93–95 per USD lifts INR revenue and margins.
The biggest weakness: CC growth is still low single digit
The biggest weakness is that growth in constant currency is still low single digit. CC revenue rose just 2.6% YoY, and the 2.5–4.0% guidance is modest. The rupee flatters the reported 11.5% INR growth, and a rupee recovery would trim it.
| Growth lens | Value |
|---|---|
| Q2 revenue growth YoY: INR / USD / CC | 11.5% / 2.2% / 2.6% |
| Q2 book-to-bill (computed, $3,258M / $3,724M) | 0.87x |
| Engineering & R&D growth, CC YoY | 2.1% |
| Engineering & R&D margin | 15.2% (−231 bps YoY) |
| 3Y revenue CAGR / 3Y PAT CAGR | 8.7% / 3.9% |
| A book-to-bill of 0.87x means record H1 bookings still have to turn into revenue. The PEG of 3.53 is flagged as poor, because the 3Y PAT CAGR of 3.9% lags the valuation. |
Valuation vs peers: a modest premium
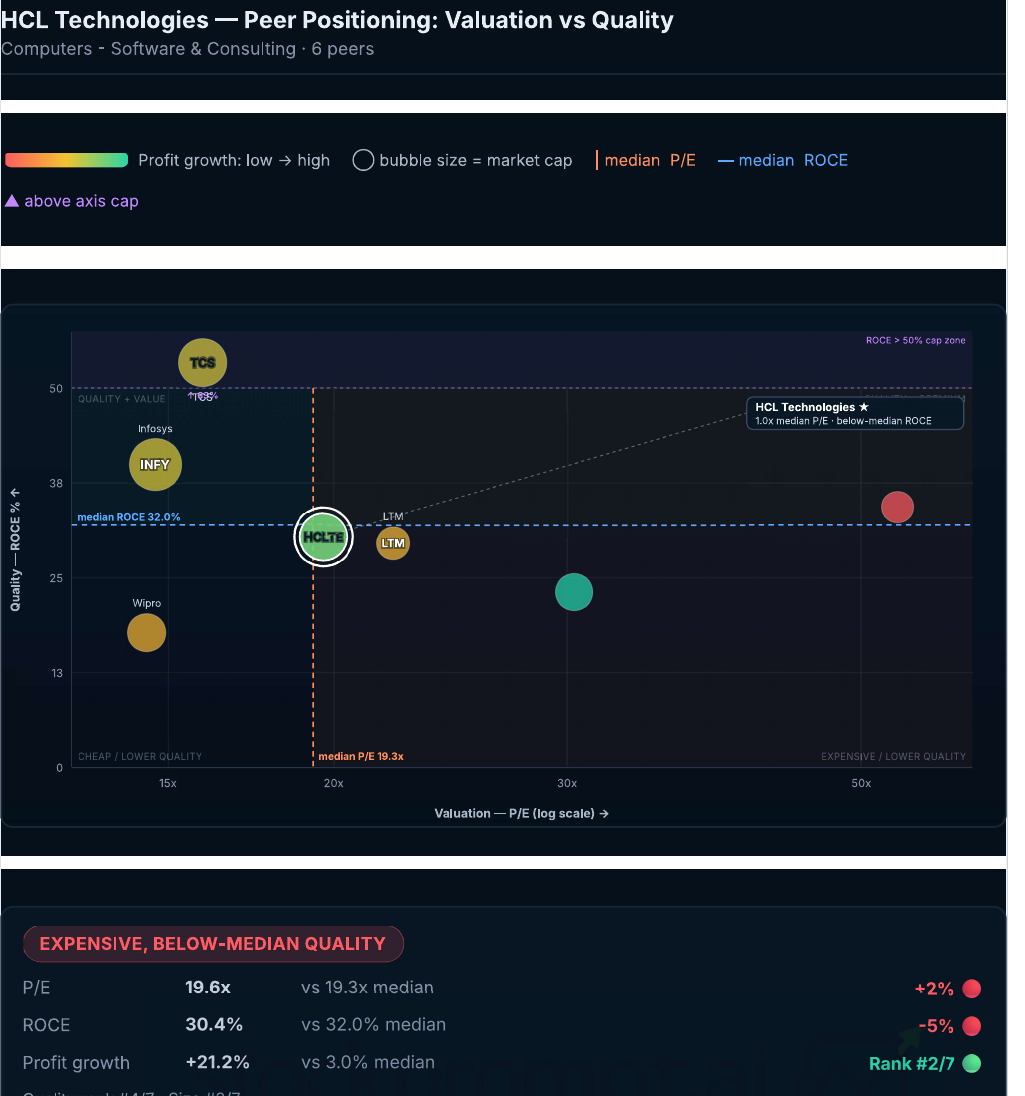
HCLTech trades at a modest premium to peers, and the model rates it fairly valued. Its trailing P/E is 20.49x on EPS of ₹67.51, against an industry P/E of 19.43x and a computed peer median of about 19.1x.
| Measure | HCLTech | Reference |
|---|---|---|
| P/E (valuation card) | 20.49x | 19.43x industry |
| P/E (peer chart) | 19.6x | 19.3x peer median |
| ROCE | 30.4% | 32.0% peer median |
| Latest profit growth | +21.2% | 3.0% peer median |
| EV/EBITDA / earnings yield | 12.1x / 4.9% | – |
| Dividend yield | 3.92% | – |
| Profit growth of 21.2% is the strongest among the large caps shown, against TCS at 7.4%, Infosys at 6.2% and Wipro at −1.4%. Only Tech Mahindra is higher, at 32.7%. The P/E is a modest premium to TCS (15.9x) and Infosys (14.7x). See our TCS and Infosys analyses for the comparison. | ||
| The premium looks justified by margin recovery and returns, with ROCE of 30.4% and a very low debt-to-equity of 0.08. Annualising Q2 EPS gives ₹75.64, or about 18.3x at the current price (computed). The high PEG shows the market is not paying for much more growth than guided. | ||
 |
||
| Peer positioning on valuation (P/E) and quality (ROCE). |
HCLTech share price: technical view and model levels
The HCLTech share price sits above both its 50-day and 200-day averages, but momentum is mixed. RSI is neutral at about 49–52, while MACD is mildly bearish, ADX of about 25.6 reads bearish and the Parabolic SAR is bearish. The technical score is 62/100.
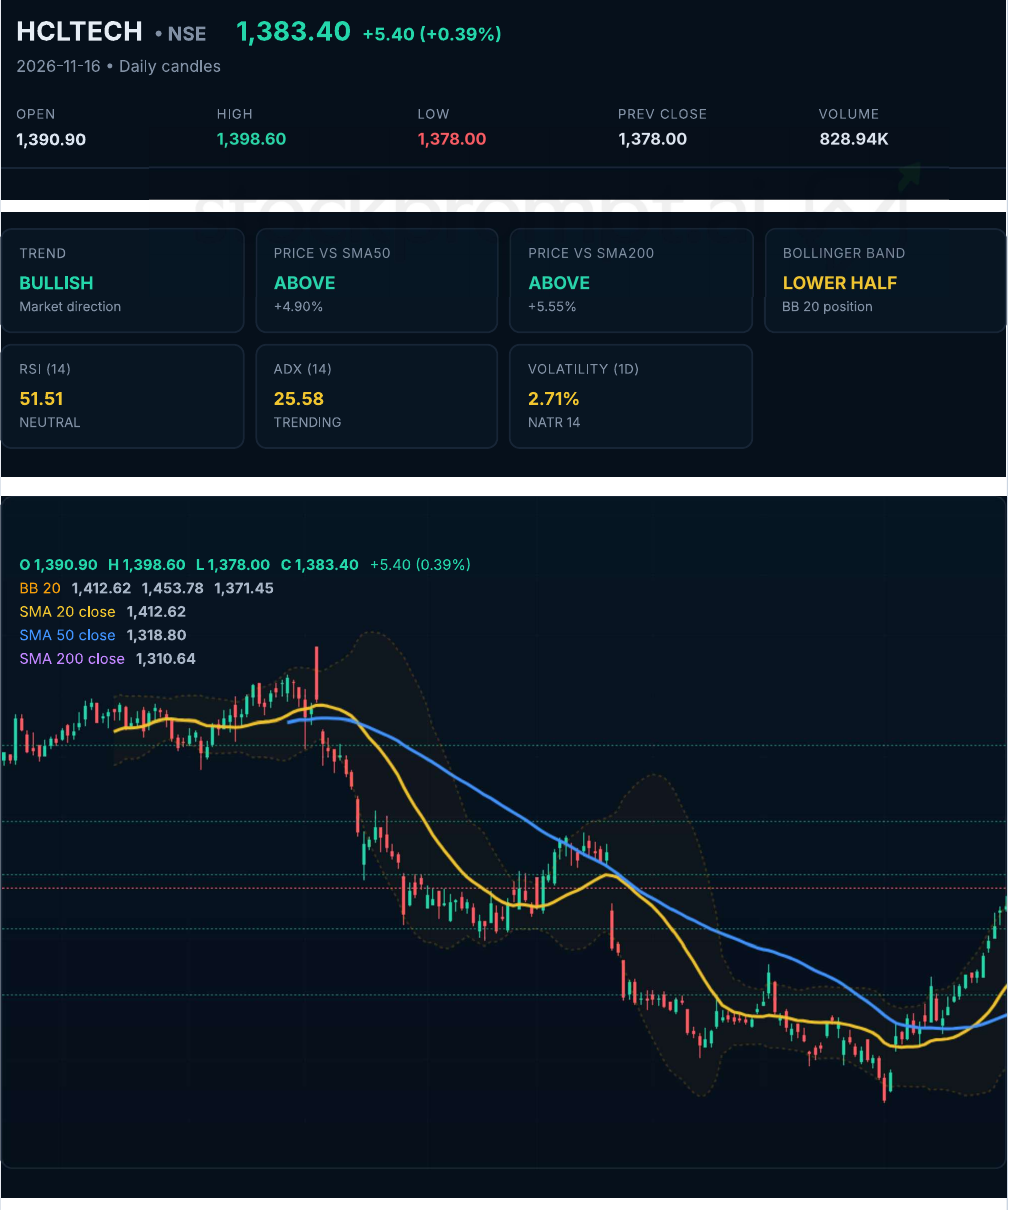 HCLTech share price: daily candles with moving averages and Bollinger Bands.
Model levels for education (2–3 month horizon)
| Level | Value |
|---|---|
| Favourable zone | ₹1,338.73–₹1,368.51 |
| Model upside levels (base / bull) | ₹1,434.28 (+3.7%) / ₹1,471.50 (+6.4%) |
| Bear scenario | ₹1,290.35 |
| Risk level | ₹1,271.73 (−8.1%) |
| Reward-risk at current price (base / bull) | 0.46x / 0.79x |
| Reward-risk near favourable zone (base / bull) | 0.98x / 1.44x |
| Risk-reward is unfavourable at the current price and only reasonable near the lower zone. The near-term score for the coming session is 67/100 with a neutral bias, after a −2 sector and −1 global adjustment. Those adjustments do not change the 70/100 composite score. |
Risks and what to watch
The main risk is AI deflation, which brokerages estimate at a 2–3% portfolio revenue impact. Faster client productivity demands could outpace new AI revenue.
- Weak CC growth: INR growth of 11.5% is flattered by a weaker rupee.
- Sector sentiment: Nifty IT fell 1.22% on 9 November on AI-monetisation worries and clients pausing spends, and HCLTech fell 2.43% that day.
- Restructuring and acquisitions: an 84 bps margin impact in Q2, with integration risk from recent acquisitions.
- Ownership: FII holding rose 0.42 pp to 15.32% and DII holding rose 0.20 pp to 18.95%, while the promoter holds 60.88% with 0% pledged.
- Legal and regulatory: no material unresolved issue surfaced, though the search was not exhaustive.
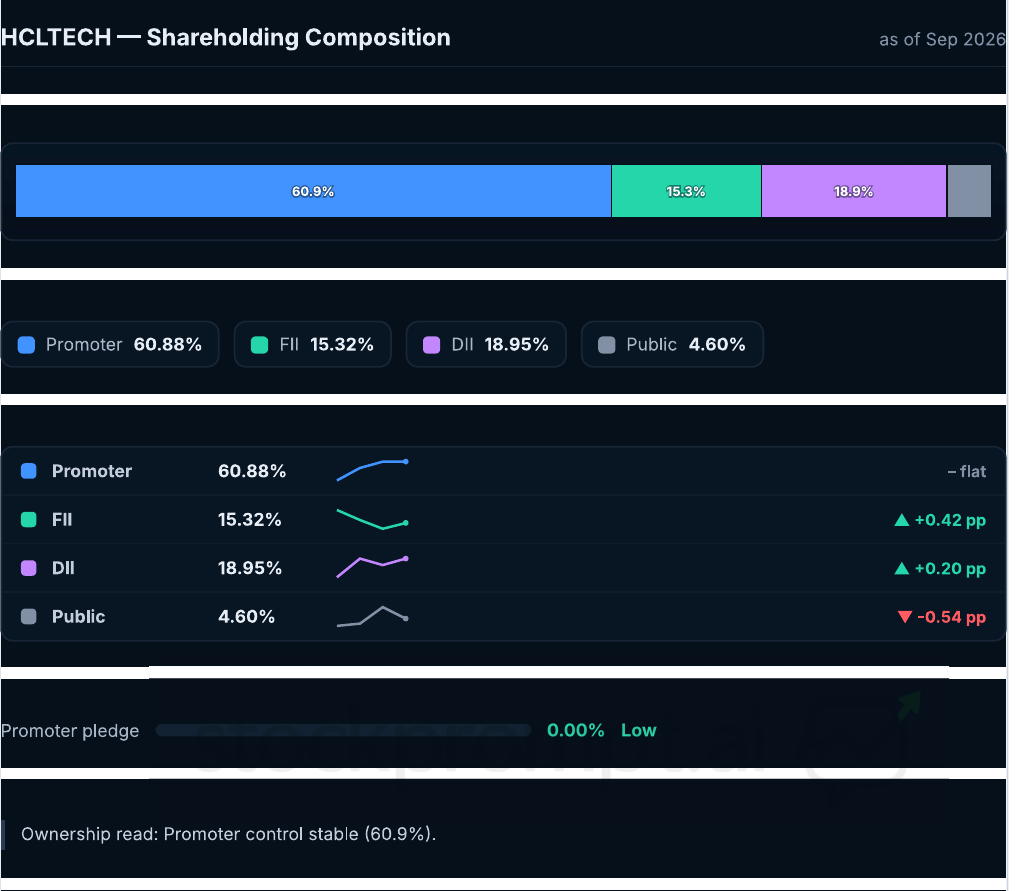 Shareholding composition as of Sep 2026.
What to watch next
- Whether quarterly CC growth moves above the 2.5–4.0% FY27 band.
- Whether record H1 bookings turn into revenue, given the 0.87x book-to-bill.
- Advanced AI revenue ($219M, 5.9% of revenue) against AI-led price deflation.
- Whether EBIT margin holds in the 17.5–18.5% range once restructuring costs fall away.
- The Engineering & R&D segment, with a 15.2% margin and 2.1% CC growth.
- Attrition of 12.5% and headcount of 2,27,181 (March 2026 data).
Conclusion
HCLTech is a margin-repair story waiting for its growth chapter. Margins and profit have already turned, with record net income and an EBIT margin up 131 bps QoQ, but CC growth of 2.6% means the stock needs top-line acceleration, not only cost discipline. A composite score of 70/100 reflects that balance, and the model’s base and bull levels sit only 3.7% and 6.4% above the current price. To see whether bookings convert and margins hold, run the analysis again after the next results on StockPrompt.ai. Explore the features, compare pricing or sign up when you are ready.
Try this on StockPrompt.ai
Paste this prompt into the StockPrompt.ai analyser:
“HCLTech Stock Analysis 2026: Can AI Services and Deal Wins Improve Its Growth Outlook?”
Frequently Asked Questions
Is HCLTech stock fairly valued?
The model rates HCLTech fairly valued, with a valuation score of 50/100. Its trailing P/E is 20.49x against an industry P/E of 19.43x, and the PEG of 3.53 is poor. The modest premium reflects margin recovery and returns.
How fast is HCLTech’s AI business growing?
Advanced AI revenue was $219M in Q2 FY27, up 78.0% YoY in constant currency and 28.4% QoQ. That is about 5.9% of quarterly revenue, with an annualised run-rate of $876M.
What are the model levels for the HCLTech share price?
For education only, the model shows a favourable zone of ₹1,338.73–₹1,368.51 and a risk level of ₹1,271.73. Its base and bull upside levels are ₹1,434.28 and ₹1,471.50, and risk-reward is unfavourable at the current price.
Disclaimer: This is AI-generated analysis for educational purposes only. AI can make mistakes, so always verify data independently. It is not SEBI-registered investment advice. Please consult a SEBI-registered advisor before making investment decisions.
Sources: Company Q2 FY27 investor release and press release, exchange data, company fundamentals and peer financials, and financial media coverage.