

Infosys cut its FY27 revenue guidance to 1–2% in constant currency (CC) on 23 October, yet the shares are still about 18.7% above their 52-week low of ₹963.20. That contrast drives this Infosys stock analysis, using data as of 16 November 2026. At ₹1,143.20 (market cap ₹4,63,863 Cr) the stock is cheap at about 15x earnings, and StockPrompt.ai scores it 59/100. The verdict is a neutral, sideways bias: the rebound is a valuation and positioning recovery, not yet an earnings recovery.
Recent results: revenue beat, CC growth only 1.5%
Q2 FY27 revenue of ₹49,244 Cr was marginally above the ₹49,132 Cr estimate, but profit growth was below estimates and CC growth was just 1.5%. The guidance cut came with the results, and the stock fell about 2.7% intraday on 26 October. Reports cited seven broker downgrades, with consensus at its lowest since January 2024.
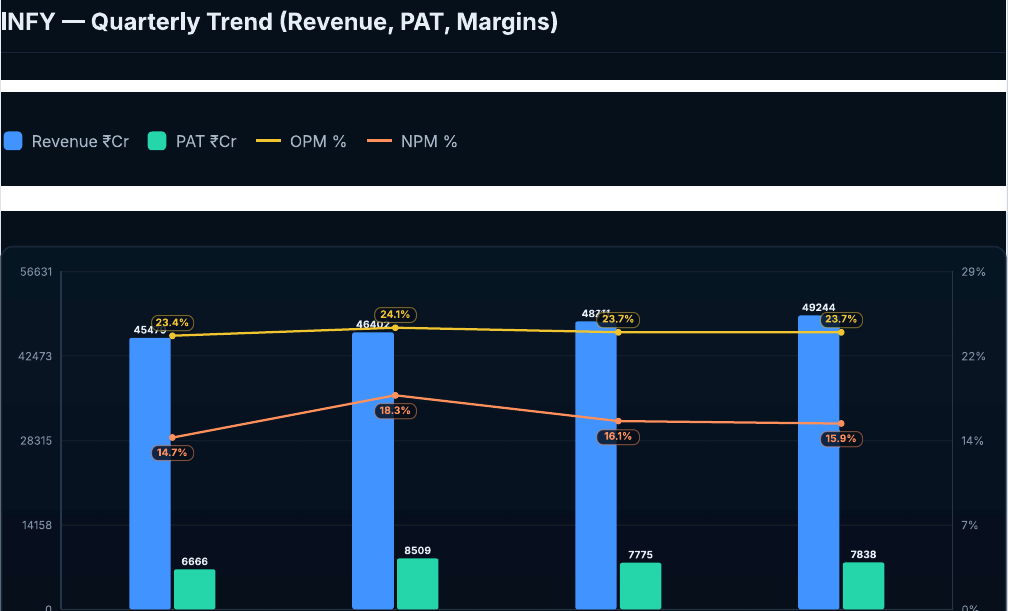
| Quarter | Revenue (₹ Cr) | Net profit (₹ Cr) | EPS (₹) |
|---|---|---|---|
| Q3 FY26 | 45,479 | 6,666 | 16.41 |
| Q4 FY26 | 46,402 | 8,509 | 20.96 |
| Q1 FY27 | 48,211 | 7,775 | 19.15 |
| Q2 FY27 | 49,244 | 7,838 | 19.28 |
| Revenue grew 2.1% QoQ in Q2, while profit was flat. The company-reported operating margin was 21.0%, flat YoY and inside the 20–22% FY27 guidance band. For help reading numbers like these, see our guide to quarterly results analysis. | |||
 |
|||
| Quarterly revenue and PAT. The chart’s operating margin (23.7%) is on a database basis, not the company-reported 21.0%. |
Growth drivers: large deals and AI revenue
Deal wins and AI revenue are the strongest part of the story. Large-deal TCV was $5.2B in Q2 FY27, against $3.1B a year earlier, and 62% of it was net new.
- Mega deal: a seven-year, net-new deal above $2B is expected to ramp in late Q4 and add over 1% to FY28 revenue growth (a broker estimate).
- AI revenue: 10.5% of revenue, up from 8.2% in Q1, which is +29% QoQ.
- Segments: life sciences grew 32.5% in CC and energy and utilities 7.3%.
- Capacity: headcount rose 1.36% QoQ to 332,542, while attrition eased to 12.7% from 13%.
- GCC push: India policy support and Global Capability Centre deals, such as the Truist collaboration.
The biggest weakness: strong deals have not reached revenue
The biggest weakness is that strong deal wins and AI revenue have not yet shown up in growth. North America, at 54.6% of revenue, fell 1.5% in CC, with retail down 7.7% and hi-tech down 17.3%.
| Q2 FY27 growth lens | Value |
|---|---|
| Revenue, rupee terms (YoY) | +10.7% |
| Revenue, constant currency (YoY) | +1.5% |
| Net profit, USD | $817M vs $839M a year earlier (−2.6%) |
| Free cash flow, USD | $928M (−15.7% YoY) |
| The 10.7% rupee growth is flattered by currency. In dollar terms revenue rose only about 1.3% and profit fell. Guidance moved down to 1–2% CC from 1.5–3%, and the market is applying what the analysis calls a “structural AI discount”. |
Valuation vs peers: cheap, with an AI discount
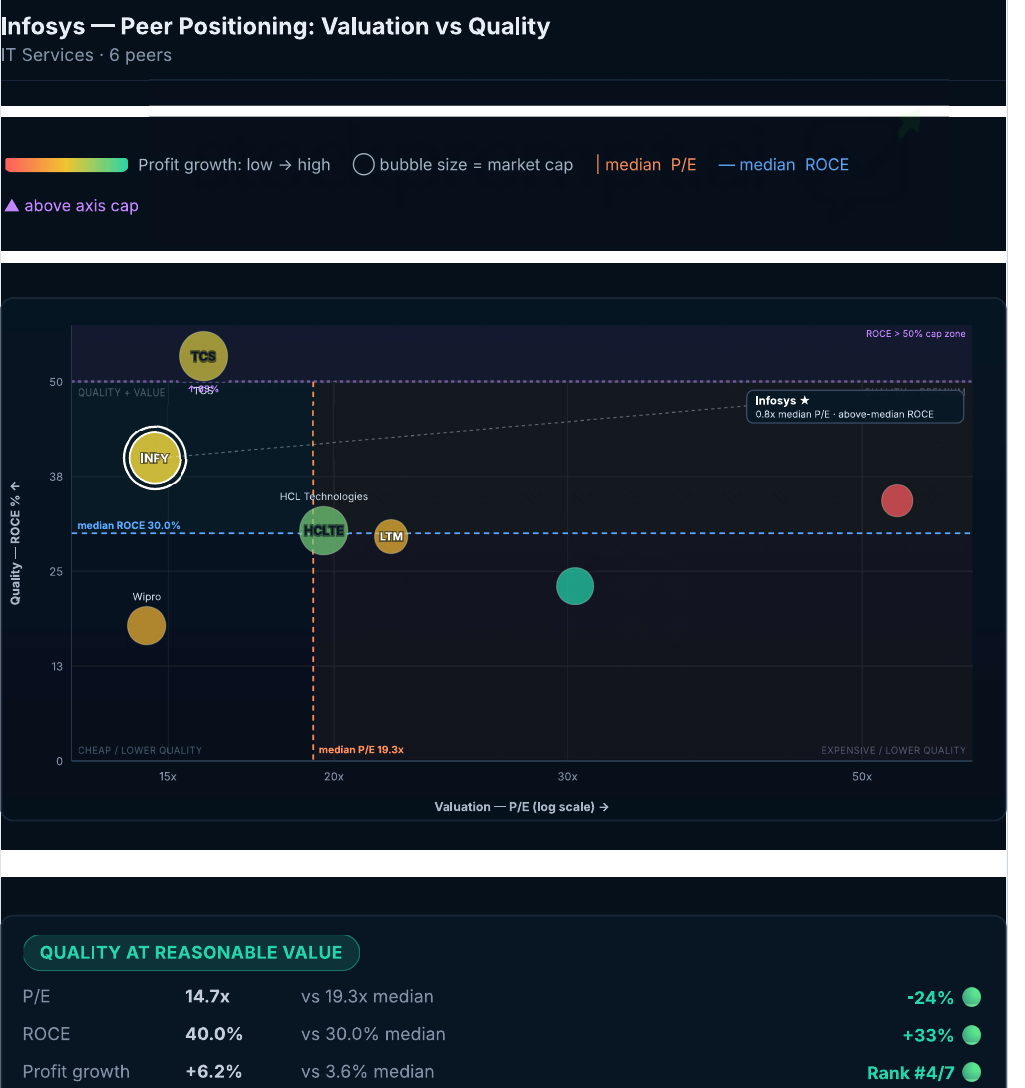
Infosys looks cheap against peers and its own returns. It trades at about 15x earnings against an industry P/E of 19.43x, and the model’s valuation score is 72/100 with a status of undervalued.
| Measure | Infosys | Reference |
|---|---|---|
| P/E (valuation card) | 15.08x | 19.43x industry |
| P/E (peer chart) | 14.7x | 19.3x peer median |
| ROCE | 40.0% | 30.0% peer median |
| Latest profit growth | +6.2% | 3.6% peer median |
| EV/EBITDA / earnings yield | 9.2x / 6.6% | – |
| Dividend yield | 4.2% | ₹26 interim dividend, up 13% |
| Peers on the peer-table basis are Wipro (14.46x), TCS (15.95x), HCLTech (19.66x), Tech Mahindra (30.38x) and Persistent (53.15x). Infosys ranks second on quality and size, and its ROCE is second only to TCS. Compare it with our TCS and HCLTech analyses. | ||
| Not everything is cheap: P/B is 4.68x and the PEG of 1.87 reflects decelerating growth. A rerating needs revenue growth to move back above the 1–2% guided range. | ||
 |
||
| Peer positioning on valuation (P/E) and quality (ROCE). |
Infosys share price: technical view and model levels
The Infosys share price is ranging: about 6–7% above the 50-day average, slightly below the 200-day, with a weak ADX of 14.6. RSI is neutral at about 54–55, and volume and OBV signals show strong accumulation. The Parabolic SAR of ₹1,082.17 is bullish, and the technical score is 56/100.
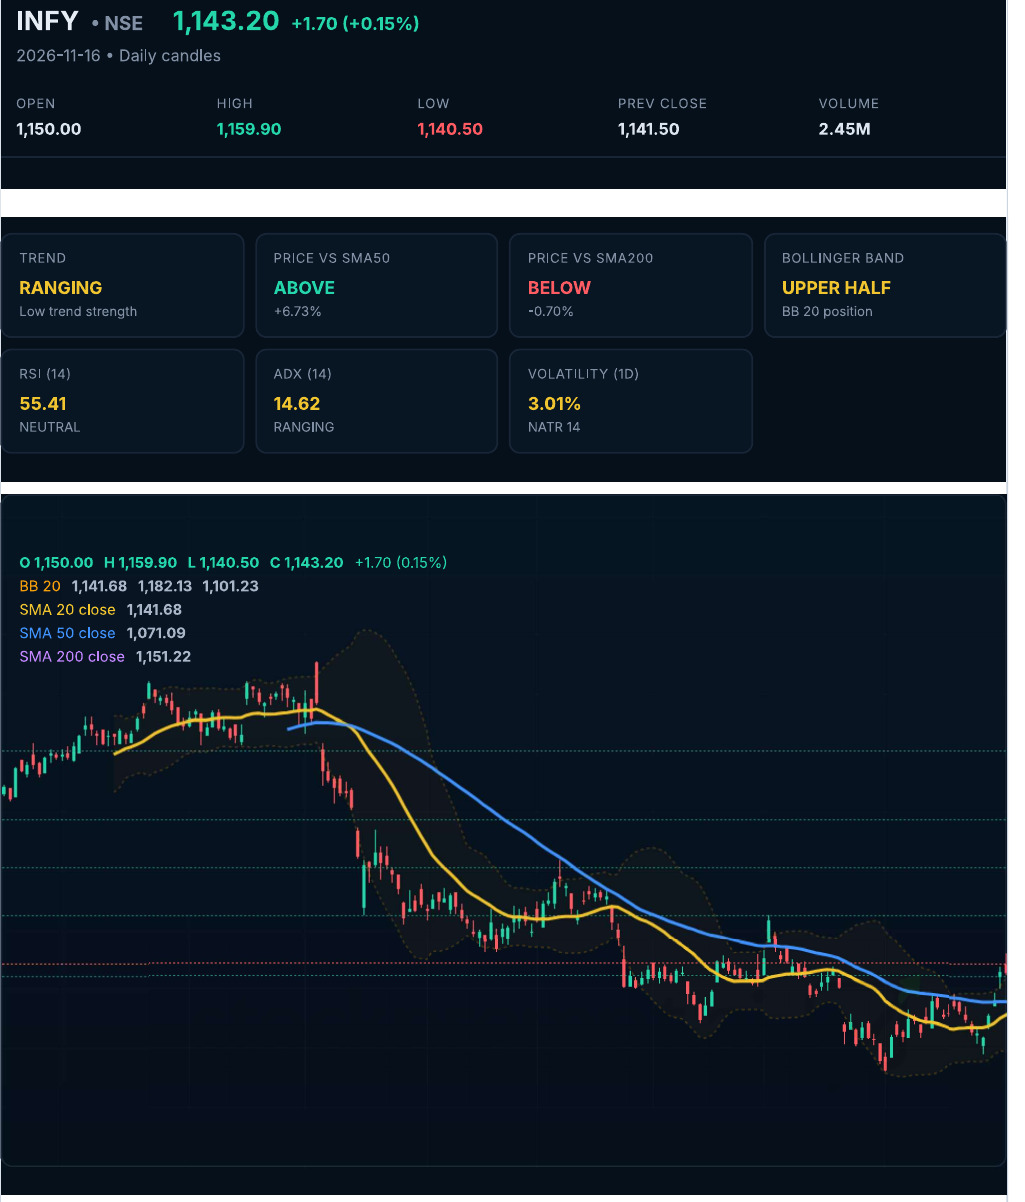 Infosys share price: daily candles with moving averages and Bollinger Bands.
Model levels for education (medium-term, about 63 trading days)
| Level | Value |
|---|---|
| Favourable zone | ₹1,102.08–₹1,129.49 |
| Model upside levels (base / bull) | ₹1,211.74 (+6.0%) / ₹1,246.01 (+9.0%) |
| Risk level (bear scenario) | ₹1,040.39 (−9.0%) (₹1,057.53) |
| Reward-risk at current price (base / bull) | 0.67x / 1.00x |
| Reward-risk near favourable zone (base / bull) | 1.27x / 1.73x |
| Fibonacci support / resistance | ₹1,103.11 (78.6%) / ₹1,212.95 (61.8%) and ₹1,290.10 (50%) |
| Bollinger band range | ₹1,101.23–₹1,182.13 |
| Risk-reward is thin at the current price and improves only on pullbacks toward ₹1,100–1,130. The near-term score for the coming session is 55/100 with a negative bias, driven by sector pressure alone. That adjustment of −4 does not change the 59/100 composite view. |
Risks and what to watch
The main risk is AI deflation: analysts warn that agentic AI could compress billable hours and pricing. Some forecasts cite revenue deflation of up to 40%, which is a bear-case estimate, not a base case.
- Demand weakness: North America and the retail and hi-tech segments are shrinking.
- US legal and regulatory overhang: reported law-firm investigation notices, an ongoing DOJ H-1B probe and a US Labor Department PERM suspension. Infosys said the suspension should not materially affect operations, and the analysis found no quantified penalty.
- Margin pressure: operating expenses grew 14.6%, faster than revenue, and brokers have flagged wage-hike risk.
- Technical: the trend is weak, with no confirmation above the 200-day average.
- Ownership: FII holding rose 0.35 pp to 27.44%, DII holding fell 0.12 pp to 42.66%, and the promoter holds 13.90% with 0% pledged.
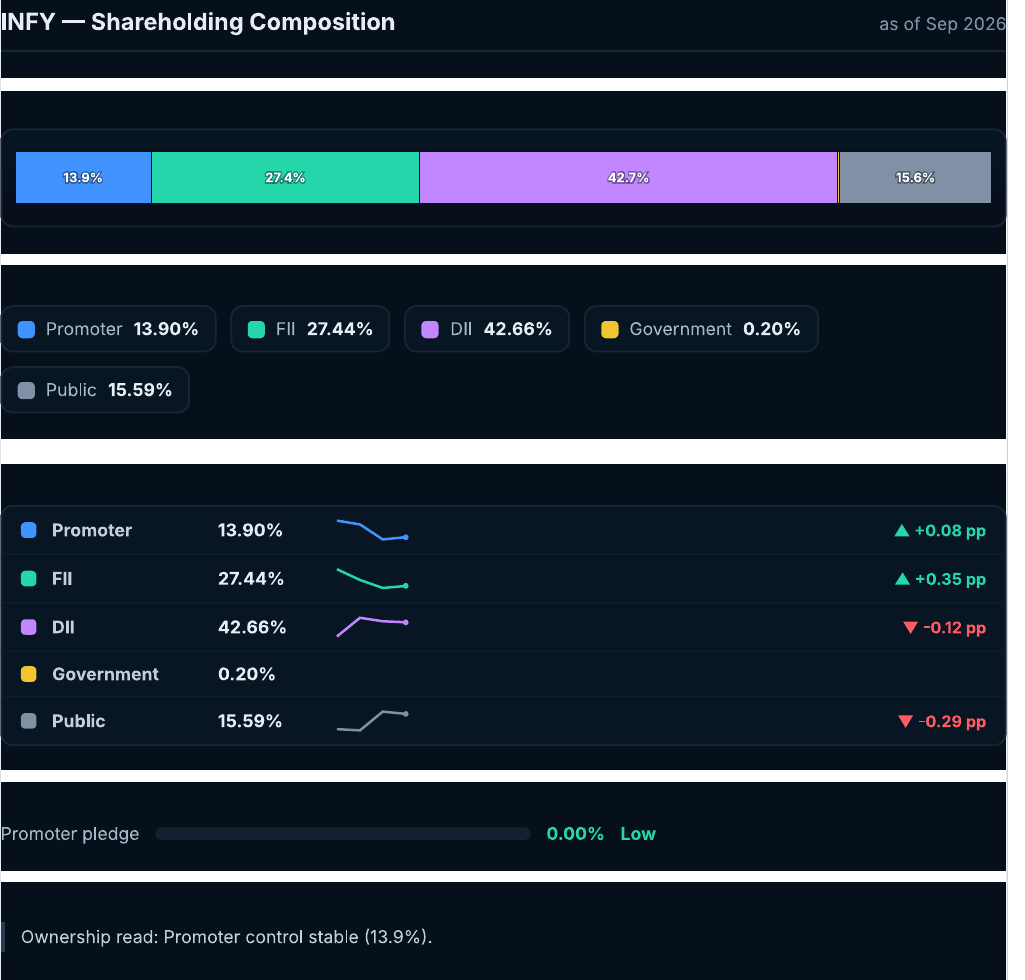 Shareholding composition as of Sep 2026.
What to watch next
- Whether the $5.2B TCV, and the mega deal’s ramp from late Q4, lifts CC growth above 2%.
- Whether the FY27 guidance range of 1–2% holds or is cut again.
- Whether AI revenue, now 10.5% of sales, is additive or re-labelled existing work.
- Margin versus the 20–22% band as pricing and productivity pass through.
- Whether declines in North America, retail and hi-tech stabilise.
- US policy developments on H-1B and PERM.
Conclusion
So is the recovery sustainable? The price has recovered about 18.7% from its low, but the earnings recovery has not happened yet. Conversion of the $5.2B of deals into revenue, additive AI revenue and stable margins would make it durable, and Q3 and Q4 FY27 are the quarters to watch. The composite score of 59/100 already reflects a −5 for the guidance cut, +2 for the mega deal and −3 for US legal overhangs. The analysis lists another guidance cut, weaker AI-driven pricing or a break below ₹1,040 as what would break the recovery. To track those signals, run the analysis yourself on StockPrompt.ai. Explore the features, compare pricing or sign up when you are ready.
Try this on StockPrompt.ai
Paste this prompt into the StockPrompt.ai analyser:
“Infosys Stock Analysis 2026: Is the IT Recovery Sustainable Amid AI Disruption?”
Frequently Asked Questions
Is Infosys stock undervalued?
The model rates Infosys undervalued, with a valuation score of 72/100. Its P/E is about 15x against an industry P/E of 19.43x, and the dividend yield is 4.2%. The market is applying a “structural AI discount”, and the PEG of 1.87 shows growth is decelerating.
What is Infosys’s FY27 revenue guidance?
Infosys cut FY27 revenue guidance to 1–2% in constant currency from 1.5–3% on 23 October. Q2 CC growth was 1.5%, and North America, 54.6% of revenue, fell 1.5% in CC. Operating margin guidance is 20–22%.
What are the model levels for the Infosys share price?
For education only, the model shows a favourable zone of ₹1,102.08–₹1,129.49 and a risk level of ₹1,040.39. Its base and bull upside levels are ₹1,211.74 and ₹1,246.01 over about 63 trading days.
Disclaimer: This is AI-generated analysis for educational purposes only. AI can make mistakes, so always verify data independently. It is not SEBI-registered investment advice. Please consult a SEBI-registered advisor before making investment decisions.
Sources: Company filings and Q2 FY27 results release, exchange data, broker reports and financial press.