

Annualised AI revenue at Tata Consultancy Services reached US$3.1 bn, up 19.2% in a single quarter, yet constant-currency (CC) growth in Q2 FY27 was only 0.5% QoQ. This TCS stock analysis, using data as of 16 November 2026, explains that puzzle and what it means for the share price. The shares trade at ₹2,396.50 (market cap ₹8,67,328 Cr), and StockPrompt.ai scores them 67/100 with a mildly bullish, watchlist verdict: strong finances and a modest multiple, but a rerating needs CC growth to improve, not just a bigger AI run-rate.
Recent results: AI is real, headline growth is mostly currency
Q2 FY27 revenue was ₹73,188 Cr, up 1.3% QoQ, but CC growth was just 0.5% QoQ. The headline rupee revenue growth of 11.2% YoY is mostly currency, against +2.4% in USD and +2.8% in CC. For context, FY26 CC growth was −2.4%.
| Q2 FY27 metric | Value | Note |
|---|---|---|
| Revenue | ₹73,188 Cr | +1.3% QoQ |
| PAT | ₹13,934 Cr | +3.8% QoQ |
| EPS | ₹38.37 | – |
| Operating margin | 24.0% | Flat QoQ, about 20 bps below consensus |
| Net margin | 19.0% | – |
| Deal wins (TCV) | US$9.6 bn | Excludes Porsche AG and GCC-to-AI deals |
| Revenue has risen for four straight quarters, but the margin miss prompted one brokerage to trim its price objective. Management also flagged about 50 bps of margin dilution from the MHP acquisition. To read results like these with more confidence, see our guide to quarterly results analysis. |
Growth drivers: AI, deal wins and BFSI
AI is the fastest-growing part of the business, and the Q2 FY27 results were reported on 8 October 2026. Annualised AI revenue is US$3.1 bn, about 10% of revenue, up from US$2.6 bn in Q1, and the analysis calls it the fastest-growing AI revenue among large peers.
- Pipeline: Q2 TCV was US$9.6 bn, excluding the Porsche AG partnership and a GCC-to-AI-centre transition deal.
- Verticals: BFSI grew 2.5% QoQ in CC, while Manufacturing and Technology & Services each grew 3.1%.
- Market size: brokerage estimates point to US$300–400 bn of incremental AI-led opportunity by 2030, and sector peers’ AI revenue is growing 10.7–29.5% QoQ.
- Scale: an order book of US$40.7 bn (FY26), 66 clients above $100M and headcount of 5,98,056.
The biggest weakness: AI is offsetting deflation, not adding
The biggest weakness is that AI has so far only offset a shrinking legacy book. Total USD revenue rose just 0.2% QoQ to $7,642 Mn, while implied AI revenue rose about $125 Mn and implied non-AI revenue fell about $107 Mn.
| Indicative split | Q1 FY27 | Q2 FY27 | Change |
|---|---|---|---|
| Annualised AI revenue | US$2.6 bn | US$3.1 bn | +19.2% QoQ |
| Total revenue (USD) | $7,624 Mn | $7,642 Mn | +0.2% |
| Implied AI revenue per quarter | $650 Mn | $775 Mn | +$125 Mn |
| Implied non-AI revenue | $6,974 Mn | $6,867 Mn | −$107 Mn (−1.5%) |
| The AI and non-AI split is an indicative estimate from the run-rate, not a reported figure. | |||
| Brokerage research agrees, describing AI deflation of about 2–3% a year on traditional services, with non-AI revenue falling about 3% YoY. Net deflation may not ease before FY28, and an easing looks more plausible in FY29. One brokerage models revenue growth of 3.4% for FY27E and 5.0% for FY28E, helped by the MHP acquisition. |
Valuation vs peers: quality at a discount
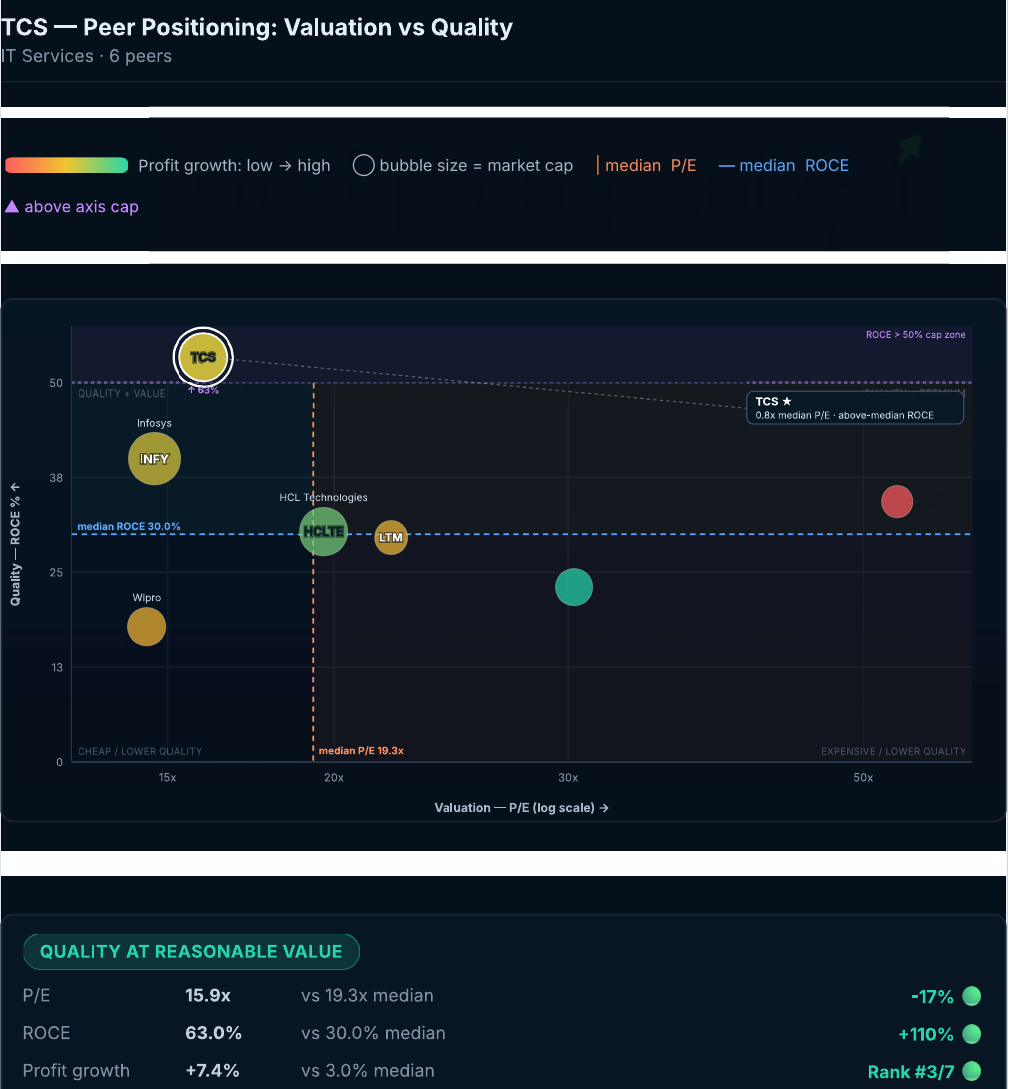
TCS trades at a discount to peers despite ranking first on quality. Its P/E is 16.8x on trailing EPS of ₹142.64, below the industry P/E of 19.43x, and the model rates the stock “Undervalued”.
| Measure | TCS | Reference |
|---|---|---|
| P/E (valuation card) | 16.8x | 19.43x industry |
| P/E (peer chart) | 15.9x | 19.3x peer median |
| ROCE | 63.0% | 30.0% peer median |
| Profit growth | +7.4% | 3.0% peer median |
| The peer set includes Infosys, HCLTech, Wipro, Tech Mahindra, LTM and Persistent, and TCS ranks first on quality and size. For a direct comparison, see our Infosys and HCLTech analyses. | ||
| The valuation score is a neutral 57/100, because P/B is 7.32x and the PEG of 2.14 is poor. The model’s base and bull levels imply about 17.7x and 18.2x trailing EPS, both below the industry P/E. Brokerage commentary adds that further upside for incumbents “requires growth delivery”. | ||
 |
||
| Peer positioning on valuation (P/E) and quality (ROCE). |
TCS share price: technical view and model levels
The TCS share price is sideways: above the 50-day average by about 4–5% and barely above the 200-day. ADX of 31.5 shows a trending market, RSI is neutral at about 48–50 and MACD is mildly bearish. The Parabolic SAR of ₹2,571.20 is bearish, and the price sits just below the lower Bollinger band of ₹2,406.82.
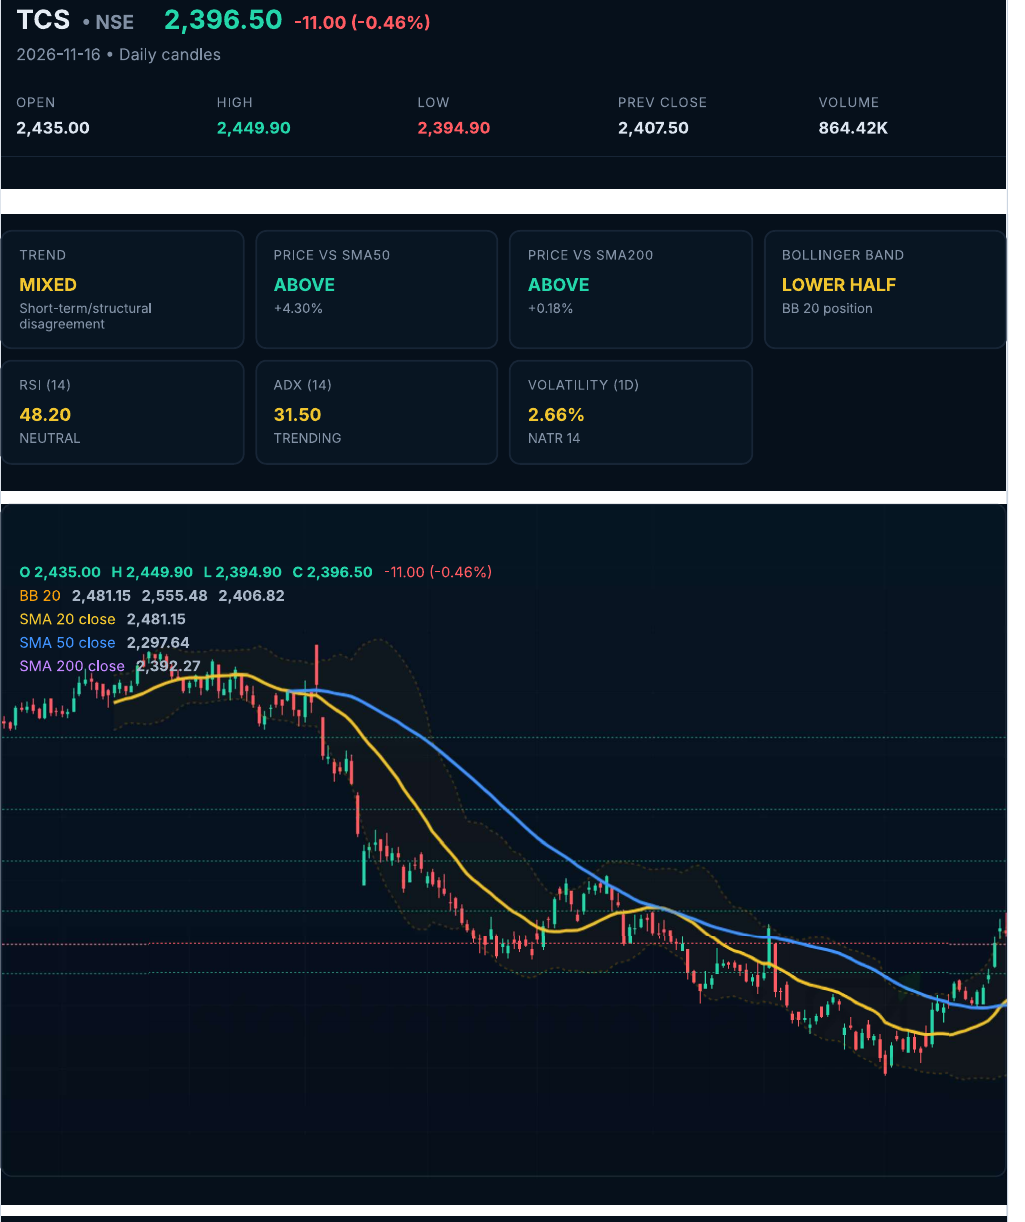 TCS share price: daily candles with moving averages and Bollinger Bands.
Model levels for education (2–4 month horizon)
| Level | Value |
|---|---|
| Favourable zone | ₹2,319.45–₹2,370.82 (−3.22% to −1.07% vs current price) |
| Model upside levels (base / bull) | ₹2,524.92 (+5.36%) / ₹2,589.13 (+8.04%) |
| Bear scenario | ₹2,235.97 |
| Risk level | ₹2,203.87 (−8.04%) |
| Reward-risk at current price (base / bull) | 0.67x / 1.00x |
| Reward-risk near favourable zone (base / bull) | 1.27x / 1.73x |
| At the current price the reward-risk is unfavourable, and it improves only near the favourable zone. The nearest Fibonacci level is 61.8% at ₹2,495.36. The near-term score for the coming session is 67/100 with a neutral bias, because global cues could not be verified. |
Risks and what to watch
The main risk is that AI model improvements deepen deflation even as use cases expand, which would keep CC growth muted. Other pressures are listed below.
- Discretionary spending: analysts say the demand environment is little changed, and every vertical except BFSI is under stress.
- Margins: investment-led pressure, bench and subcontracting costs, and MHP dilution.
- Sentiment reversal: Nifty IT rose 17.69% in October, so the rebound may reflect repositioning more than earnings.
- Technical: the SAR is bearish and the price trades near the lower Bollinger band.
- Ownership: promoter holding is 71.77% and flat, FII holding is 9.01% (−0.06 pp), DII holding is 13.57% (+0.16 pp) and pledge is 0%.
- Legal and regulatory: the analysis found no material unresolved action against TCS.
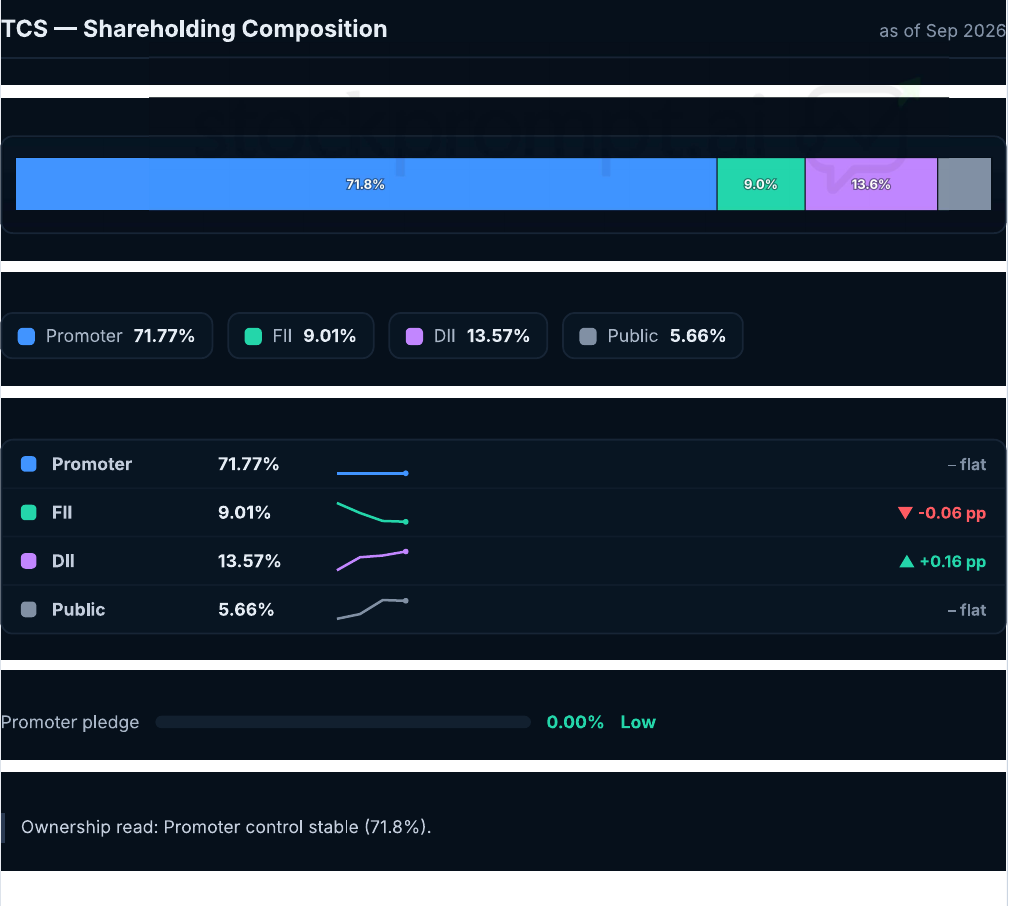 Shareholding composition as of Sep 2026.
What to watch next
- CC revenue growth in Q3 FY27, where furloughs and deals that slipped from Q2 are the swing factors.
- Whether AI’s incremental revenue stays well above the non-AI decline.
- Operating margin against MHP dilution of about 50 bps and AI investment costs.
- TCV conversion of the US$9.6 bn, plus the Porsche AG and GCC-to-AI deals, into revenue.
- Consumer, Energy & Utilities and Regional Markets, which declined in Q2.
- Headcount (5,98,056) and attrition (13.3%).
Conclusion
For TCS the question is no longer whether AI demand exists, but when it outruns deflation in the legacy book. Until CC growth lifts, the quality is visible in ROCE of 63%, zero debt and strong cash conversion, but the growth is not. A composite score of 67/100, after a −2 overlay for the margin miss and MHP dilution, reflects that balance. To see how the score and model levels move after Q3 FY27, run the analysis yourself on StockPrompt.ai. Explore the features, compare pricing or sign up when you are ready.
Try this on StockPrompt.ai
Paste this prompt into the StockPrompt.ai analyser:
“TCS Stock Analysis 2026: Can AI Demand Translate Into Stronger Revenue Growth?”
Frequently Asked Questions
Is TCS stock undervalued?
The model rates TCS “Undervalued”, with a P/E of 16.8x against an industry P/E of 19.43x. The valuation score is a neutral 57/100, and the PEG of 2.14 is poor. Further upside depends on growth delivery.
How big is TCS’s AI business?
Annualised AI revenue is US$3.1 bn, up 19.2% QoQ and about 10% of revenue. However, CC growth was only 0.5% QoQ in Q2 FY27, because the AI gains so far offset a shrinking traditional services book.
What are the model levels for the TCS share price?
For education only, the model shows a favourable zone of ₹2,319.45–₹2,370.82 and a risk level of ₹2,203.87. Its base and bull upside levels are ₹2,524.92 and ₹2,589.13 over a 2–4 month horizon.
Disclaimer: This is AI-generated analysis for educational purposes only. AI can make mistakes, so always verify data independently. It is not SEBI-registered investment advice. Please consult a SEBI-registered advisor before making investment decisions.
Sources: Company Q2 FY27 results release and fact sheet, exchange filings, brokerage sector research and public peer financials.