

Jio Credit’s assets under management rose 154% year on year to ₹37,320 Cr, yet Jio Financial Services reported a 51% fall in Q2 FY27 profit to ₹340 Cr. That gap is the heart of this Jio Financial stock analysis, based on data as of 16 November 2026. The shares trade at ₹226.26 with a market cap of ₹1,54,812 Cr. StockPrompt.ai’s verdict: a neutral, sideways bias with a score of 50/100, because operations are scaling faster than profit and returns while the price already assumes execution.
Recent results: profit fell 51%, mostly on dividend timing
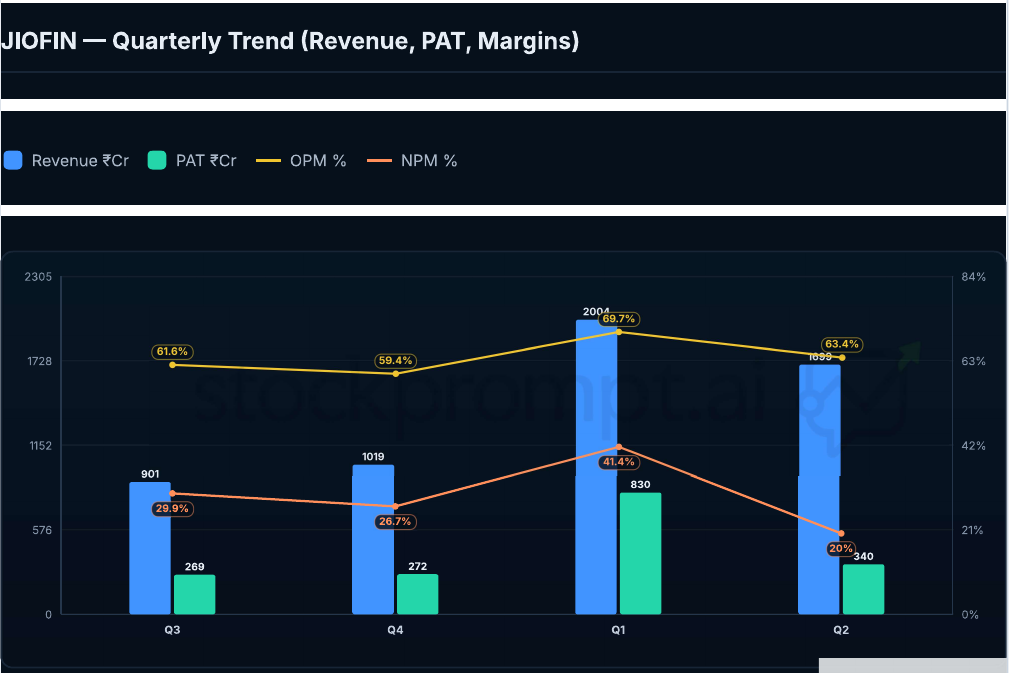
Headline profit fell sharply in Q2 FY27, but the drop mostly reflects dividend timing rather than weaker operations. Q2 PAT was ₹340 Cr, down 51% year on year and 59% on the previous quarter. Management says profit before tax excluding dividend rose 51% to ₹489 Cr, because Q2 FY26 included ₹269 Cr of dividend income and Q2 FY27 had none.
| Q2 FY27 metric | Value | Change |
|---|---|---|
| Pre-provisioning operating profit | ₹574 Cr | +85% YoY |
| PAT | ₹340 Cr | −51% YoY |
| Finance cost | ₹578 Cr | +325% YoY |
| Jio Credit PAT | ₹120 Cr | +140% YoY |
| Jio Credit net interest income | ₹302 Cr | +116% YoY |
| Jio Credit’s own PAT more than doubled, but finance cost jumped 325% and associates and joint ventures added a ₹44 Cr loss. Coverage cited in the analysis put the PAT miss at about 27% against brokerage estimates. | ||
 |
||
| Quarterly revenue and PAT, with operating and net margins. | ||
| PAT has been lumpy over four quarters: ₹269 Cr, ₹272 Cr, ₹830 Cr (which included dividend income) and ₹340 Cr. Over H1 FY27, PAT was ₹1,171 Cr against ₹1,020 Cr a year earlier, up 14.8%. If you want a refresher on reading results like these, see our guide to quarterly results analysis. |
Growth drivers: credit, asset management and payments
Credit is scaling fastest of all the businesses. Jio Credit AUM climbed from ₹173 Cr in March 2024 to ₹37,320 Cr in September 2026, with record quarterly disbursements of ₹13,135 Cr, up 98% year on year.
| Business scorecard (₹ Cr) | Mar 2025 | Mar 2026 | Sep 2026 |
|---|---|---|---|
| Jio Credit AUM | 10,053 | 25,711 | 37,320 |
| Payments Bank deposits | 295 | 544 | 643 |
| JioBlackRock AUM | – | – | 22,746 |
- Capital: Bank of America will invest up to ₹18,268 Cr for up to 49.9% of Jio Credit, subject to approvals, starting with a 26.5% equity stake and warrants later.
- Asset management: JioBlackRock AUM is up 57% year on year, and its Specialised Investment Fund reached ₹478 Cr within three months of launch.
- Payments: net processing margin improved to 14 bps from 9 bps a year earlier.
- Distribution: the parent ecosystem reaches about 533M subscribers, and the Jio Financial app has 3.2 Cr users.
The biggest weakness: thin returns on a large equity base
The biggest weakness is that returns remain thin on a large equity base. ROE is 1.19% and ROCE 1.86% on about ₹1.3 lakh Cr of consolidated equity, against earnings that are small relative to a ₹1.55 lakh Cr market cap. Funding is the pressure point as the loan book grows. Finance cost rose 325% year on year, free cash flow was −₹15,439 Cr and operating cash flow to PAT was −9.02x, which the analysis attributes to funding the lending book. Interest cover of 2.4x is weak. Debt is modest, with a D/E of 0.32, so this is a profitability question, not a leverage scare. The value case depends on ROE rising as lending, asset management and payments scale.
Valuation vs peers: the price runs ahead of profit
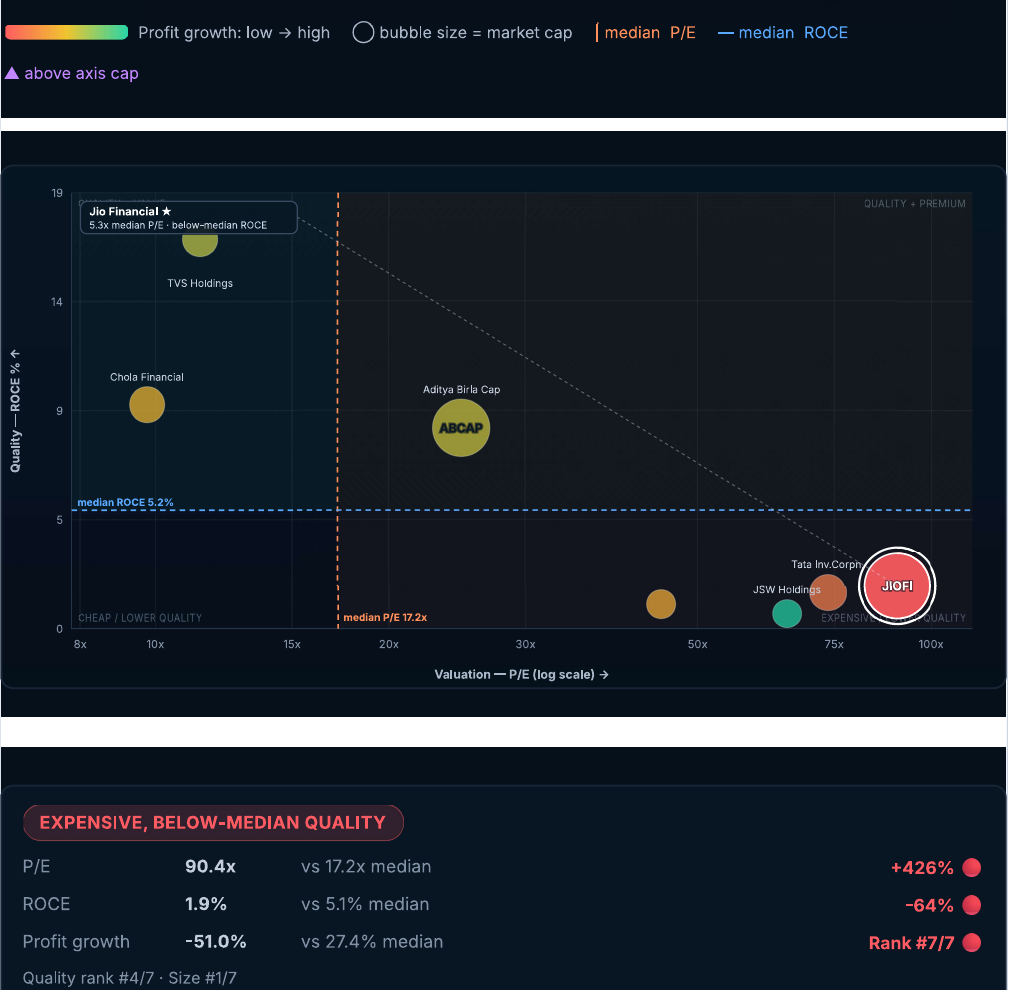
Jio Financial trades at about 86x earnings, in the 100th percentile of its peer set. The model’s valuation score is 31/100, flagging the stock as overvalued and valuation-constrained.
| Measure | JIOFIN | Reference |
|---|---|---|
| P/E (valuation card) | 86.03x | 21.82x industry |
| P/E (peer-set chart) | 90.4x | 17.2x peer median |
| ROCE | 1.9% | 5.1% peer median |
| Profit growth | −51.0% | 27.4% peer median |
| P/B | 1.16x | 0.73x industry |
| Named peers are Aditya Birla Capital (P/E 24.8x), Chola Financial (9.8x) and Tata Investment (73.6x). The analysis calls the set a loose fit, because no listed company has the same structure. For another financial-sector view, compare it with our Bajaj Finance analysis or the diversified-group story in our Kotak Mahindra Bank analysis. | ||
| Book value looks less stretched, since P/B of 1.16x sits on ₹196.26 per share of net worth that is mostly equity still being deployed. Annualising Q2 pre-provisioning profit gives ₹2,296 Cr, so market cap is about 67x that run-rate. The analysis describes this as simple arithmetic, not a forecast. | ||
 |
||
| Peer positioning on valuation (P/E) and quality (ROCE). |
Jio Financial share price: technical view and model levels
The JIOFIN price trend is sideways, a few per cent above the 50-day average and roughly 4–5% below the 200-day. ADX of about 33 shows a trending market, MACD is bullish and RSI sits between 57 and 60, which is neutral. The stock has trailed its benchmark by 9.1% over 63 days, and the technical score is 55/100.
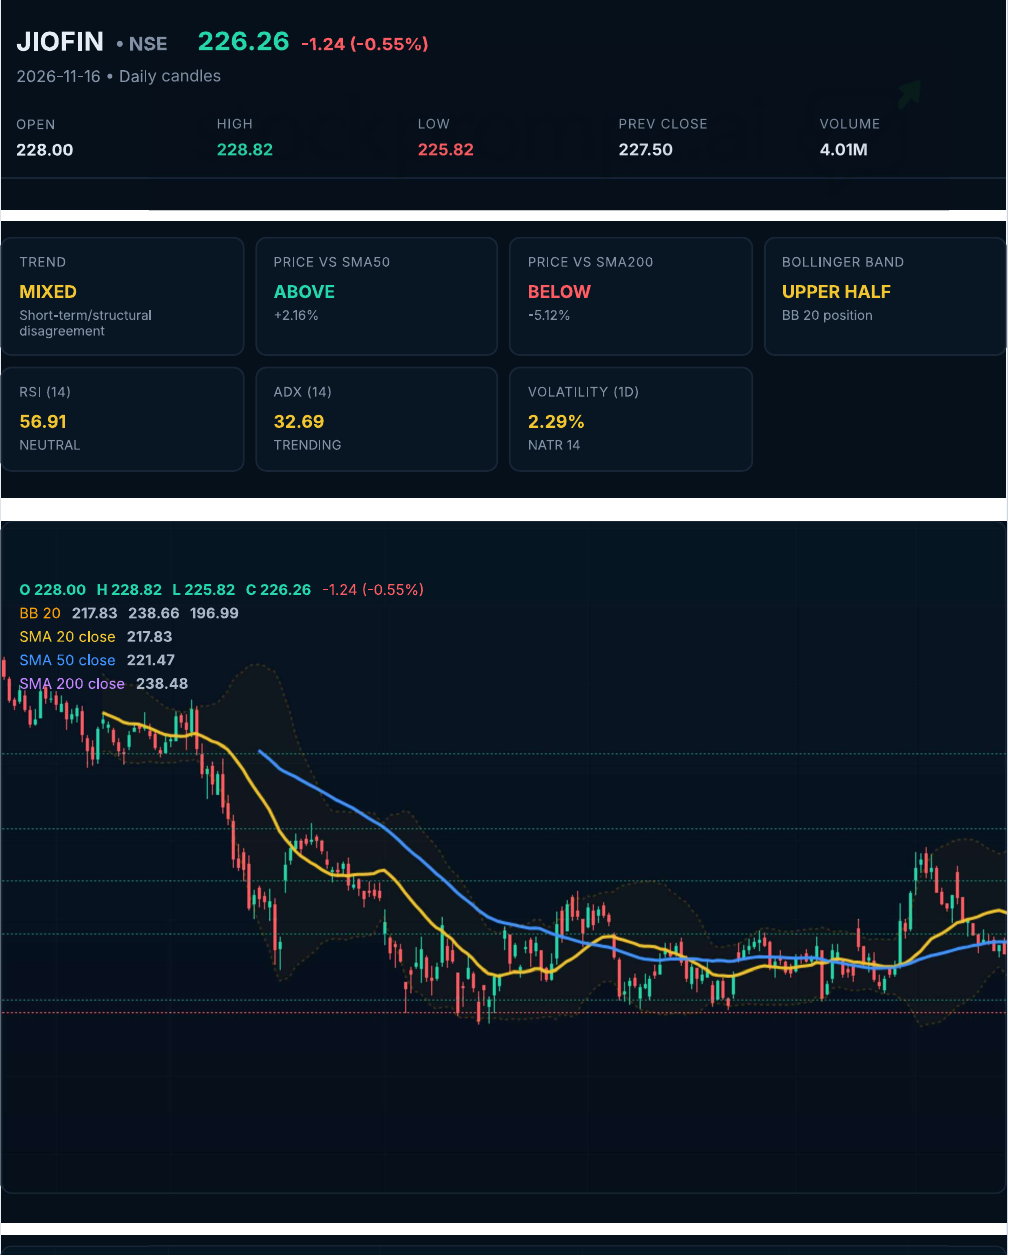 Jio Financial share price: JIOFIN daily candles with moving averages and Bollinger Bands.
Model levels for education (medium-term, about 63 trading days)
| Level | Value |
|---|---|
| Favourable zone | ₹220–₹224.17 |
| Model upside levels (base / bull) | ₹236.69 / ₹241.91 |
| Risk level (bear scenario) | ₹210.61 (₹213.22) |
| Reward-risk at current price (base / bull) | 0.67x / 1.00x |
| Reward-risk near favourable zone (base / bull) | 1.27x / 1.73x |
| Reference levels | Parabolic SAR ₹217.08 (bullish); Fib 78.6% ₹227.50 |
| At the current price the base-case reward-risk ratio is below 1x, and it improves only near the favourable zone. The analysis labels the bull level as tactical only, not a fair-value objective. The near-term score for the coming session is 45/100 with a mildly negative bias, as NBFCs and asset managers face rate-hike expectations, a weaker rupee and foreign outflows. |
Risks and what to watch
The main risk is that profit quality and funding costs disappoint just as Jio Financial’s share price asks for flawless execution.
- Earnings quality: PAT is volatile and depends on dividend and associate income.
- Funding and rates: finance cost is up 325%, and recent coverage points to an RBI repo rate of 5.5% after a hike, crude above $100 and high US yields.
- Deal and execution: the Bank of America joint venture needs approvals, and the lending arm has yet to scale unsecured consumer credit.
- Ownership flows: FII holding fell 0.65 pp to 10.00% and DII holding fell 0.57 pp to 12.73%, while the promoter stake rose 1.86 pp to 50.99% with 0% pledge.
- Legal and regulatory: the analysis found no unresolved SEBI, RBI or litigation overhang.
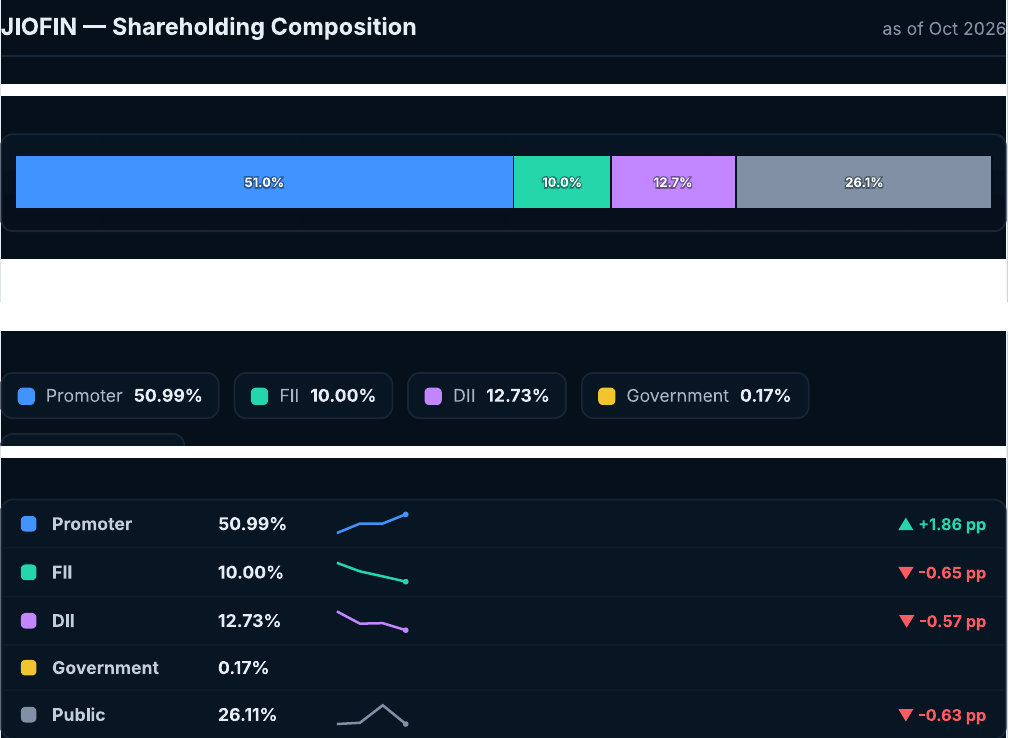 Shareholding composition as of Oct 2026.
What to watch next
- Regulatory approval and closing of the Bank of America joint venture in Jio Credit.
- Jio Credit AUM, net interest income, provisions and asset quality as the book moves into more consumer segments.
- Finance cost against net interest income, since funding costs are growing faster.
- Operating profit excluding dividends, which is the real earnings trend.
- JioBlackRock AUM, payments volumes and Payments Bank deposits.
- A turnaround in ROE and operating cash flow.
Conclusion
This Jio Financial stock analysis comes down to reading the right line of the income statement. Headline PAT is noisy because of dividends and associates, so operating profit excluding dividends, Jio Credit AUM and ROE are the lines that show whether growth is turning into earnings. The composite score of 50/100, which includes +2 for the Bank of America deal, captures that balance: strong operations, weak profit optics and a stretched multiple. To see how the score and model levels shift after the next results, run the same analysis on StockPrompt.ai. Explore the features, compare pricing or sign up when you are ready.
Try this on StockPrompt.ai
Paste this prompt into the StockPrompt.ai analyser:
“Jio Financial Stock Analysis 2026: Can Its Digital Financial Services Business Deliver on Its Potential?”
Frequently Asked Questions
Is Jio Financial stock overvalued?
The model flags Jio Financial as overvalued and valuation-constrained, with a valuation score of 31/100. Its P/E is about 86x against an industry P/E of 21.82x. P/B of 1.16x is less stretched, against an industry P/B of 0.73x.
Why did Jio Financial’s profit fall 51% in Q2 FY27?
Q2 PAT fell to ₹340 Cr mainly because Q2 FY26 included ₹269 Cr of dividend income and Q2 FY27 had none. Management says profit before tax excluding dividend rose 51% to ₹489 Cr. A ₹44 Cr loss from associates and joint ventures also weighed on the quarter.
What are the model levels for the Jio Financial share price?
For education only, the model shows a favourable zone of ₹220–₹224.17 and a risk level of ₹210.61. Its base and bull upside levels are ₹236.69 and ₹241.91, which the analysis calls tactical only and not a fair-value objective.
Disclaimer: This is AI-generated analysis for educational purposes only. AI can make mistakes, so always verify data independently. It is not SEBI-registered investment advice. Please consult a SEBI-registered advisor before making investment decisions.
Sources: Company filings, the Q2 FY27 earnings presentation and call transcript, exchange disclosures, press coverage and publicly available peer financials.