

State Bank of India has just reported gross NPAs of 1.39%, the lowest in over 20 years, alongside loan growth of about 18%. This SBI share price analysis asks whether the price already reflects that strength. At ₹1,076.05 on 12 November 2026, the stock is about 10% above where it traded after the Q2 results. Our model scores SBIN 71/100 and reads it as moderately bullish, but near-term risk-reward is thin at the current price.
Q2 FY27 results: profit up 14% and the books are cleaner
SBI’s standalone profit after tax was ₹23,038 crore in Q2 FY27, a record. That is 14.28% higher than a year ago and 9.07% higher than the previous quarter. Net interest income (NII) grew 14.69% to ₹49,143 crore.
| Metric | Q2 FY27 | Change |
|---|---|---|
| Standalone PAT | ₹23,038 Cr | +14.28% YoY |
| Consolidated PAT | ₹25,741 Cr | +19.7% YoY |
| Net interest income | ₹49,143 Cr | +14.69% YoY |
| Operating profit | ₹34,226 Cr | +7.28% YoY |
| H1 FY27 standalone PAT | ₹44,159 Cr | +12.31% YoY |
One detail deserves attention. Operating profit grew only 7.28%, well below PAT growth, so lower provisions did part of the work. H1 FY27 return on equity was 18.68% (15.4% on a full-year basis), with H1 return on assets at 1.14%.
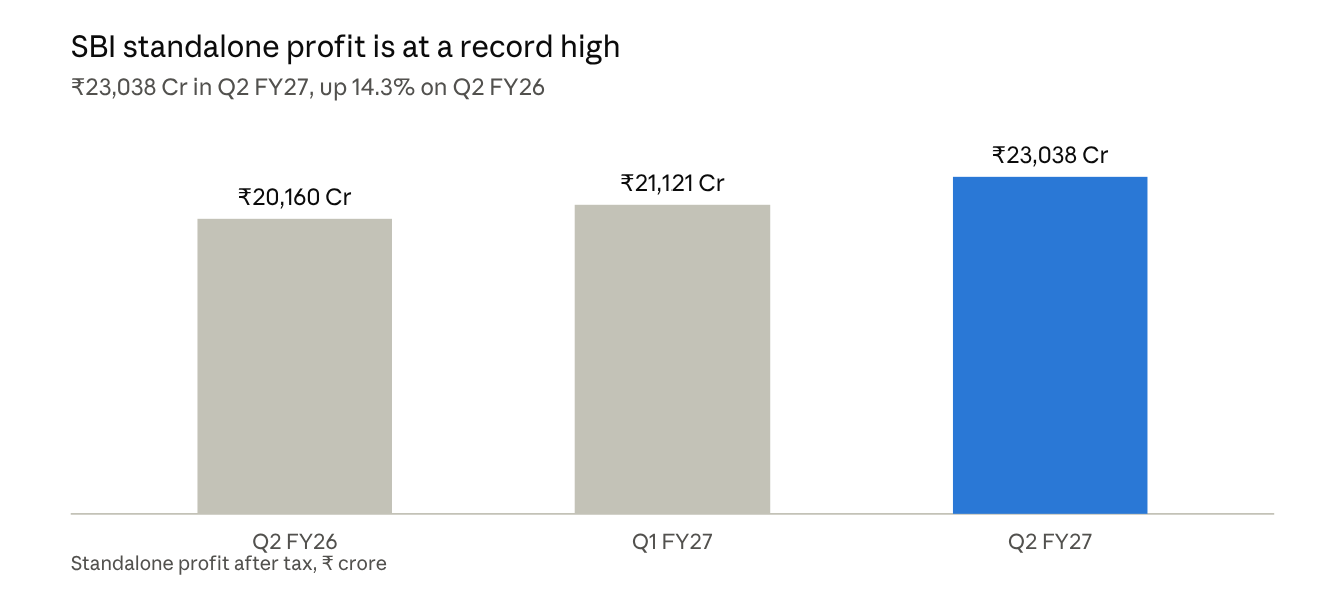
StockPrompt.ai analysis of SBIN, 12 Nov 2026 · standalone PAT, Q2 FY26 to Q2 FY27
The trend is clearly upward. For the full quarterly breakdown, see our quarterly results guide and SBI’s Q2 FY27 filing.
Growth drivers: loans, margins and record-low NPAs
Loan growth of about 18% is running well above SBI’s 14–15% FY27 guidance, and it is broad. Retail, agri and SME advances grew 18.20% and corporate advances 18.05% year on year in Q1 FY27. Post-Q2 commentary also points to a corporate pipeline of about ₹7.8 lakh crore.
The SBI net interest margin is recovering. Domestic NIM was 3.11% in Q2 FY27, up 11 bps on the quarter, and management guides to about 3% through the cycle.
| Bank metric | Latest | Earlier |
|---|---|---|
| Gross NPA | 1.39% (Q2 FY27) | 1.47% Q1 FY27; 2.24% Mar 2024 |
| Net NPA | 0.38% (Q1 FY27) | 0.57% Mar 2024 |
| Credit cost | 0.27% (Q1 FY27) | 0.47% a year earlier |
| Domestic NIM | 3.11% (Q2 FY27) | 3.00% Q1 FY27; 3.22% FY25 |
| CASA ratio | 39.24% (Jun 2026) | 39.46% Mar 2026 |
| Capital adequacy (CRAR) | 16.09% (Q2 FY27) | Up 147 bps YoY |
Provision coverage is 74.20% (91.82% including AUCA), which the model calls a strong buffer. SBI GNPA has fallen steadily, as the chart shows.
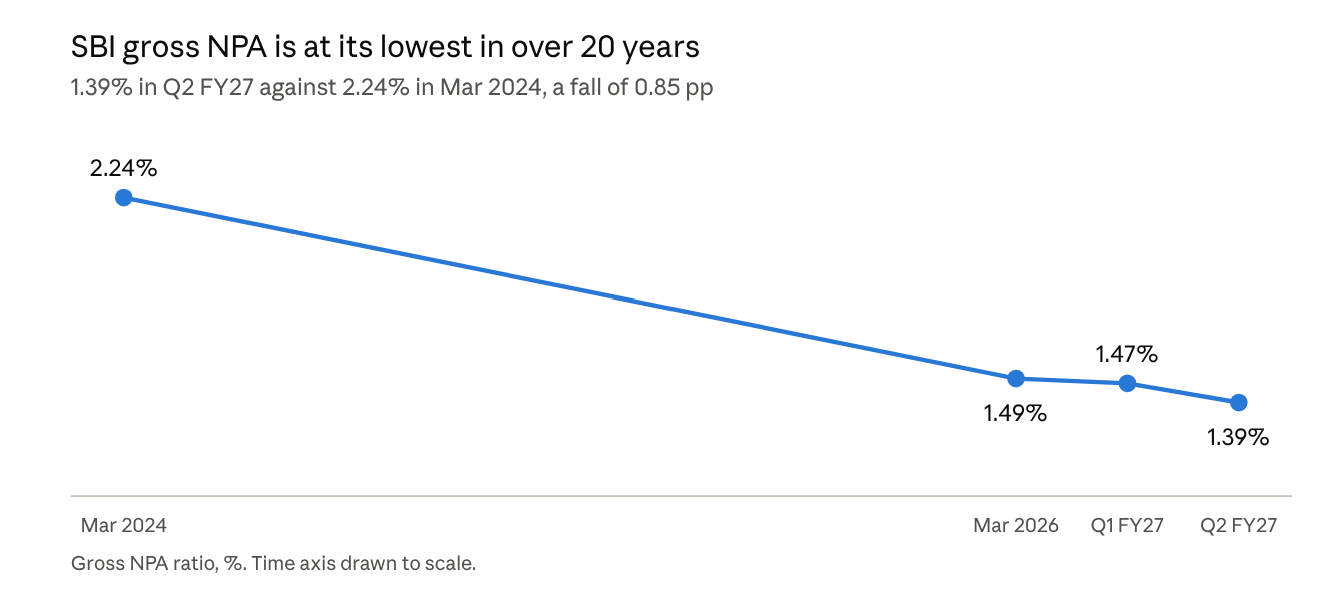
StockPrompt.ai analysis of SBIN, 12 Nov 2026 · gross NPA, Mar 2024 to Q2 FY27
Franchise strength supports these numbers. SBI has 23,265 domestic branches, 10.02 crore YONO users, and more than 64% of savings accounts opened digitally in Q1 FY27. Promoter holding is 55.45% with no pledge.
The biggest weakness: the price, not the balance sheet
The model’s main concern is how far the stock has already moved. SBIN has risen from about ₹975 on 4 November to ₹1,076.05, a gain of about 10.36% in little more than a week. At the current price, the model’s risk-reward is only 0.67:1.
Risk-reward improves to 1.27:1 near the model’s favourable zone of ₹1,048.96–₹1,067.02. The near-term outlook is neutral, with a score of 73/100. Stretched indicators, including an RSI above 70, argue for consolidation before any further move.
Valuation vs PSU peers: a premium for quality, but growth ranks last
For banks, price-to-book is the right lens. SBIN trades at 1.45x P/B on a book value of ₹727.56, and at about 11.5x P/E on EPS of ₹93.39. The dividend yield is 1.78% and market capitalisation is ₹9,94,615 crore.
Against six PSU bank peers, that is a clear premium. Peer P/E ratios range from 5.87x to 9.63x, with a median of about 7.2x. SBI ranks first on size and fourth of seven on quality. On the peer dataset’s latest-quarter profit growth, it ranks seventh of seven, which limits how far the premium can stretch.
The model’s base level of ₹1,121.19 implies about 1.54x P/B and the bull level of ₹1,143.76 about 1.57x. It labels this “valuation-constrained”, so any upside is tactical rather than a fair-value estimate. Brokerages quoted around 4 November carry positive ratings with price objectives of ₹1,225–₹1,350. These sit above the model’s levels and did not affect its score.
Ownership is steady: promoters 55.45%, FIIs 11.07% (up 0.26 pp) and DIIs 26.21% (down 0.31 pp).
SBIN technical analysis and model levels for education
The trend is up. SBIN trades above its 50-day and 200-day moving averages, MACD is bullish and ADX is about 36, which signals a strong trend. RSI is above 70, which is overbought. The 52-week range is ₹939.40–₹1,227.80.
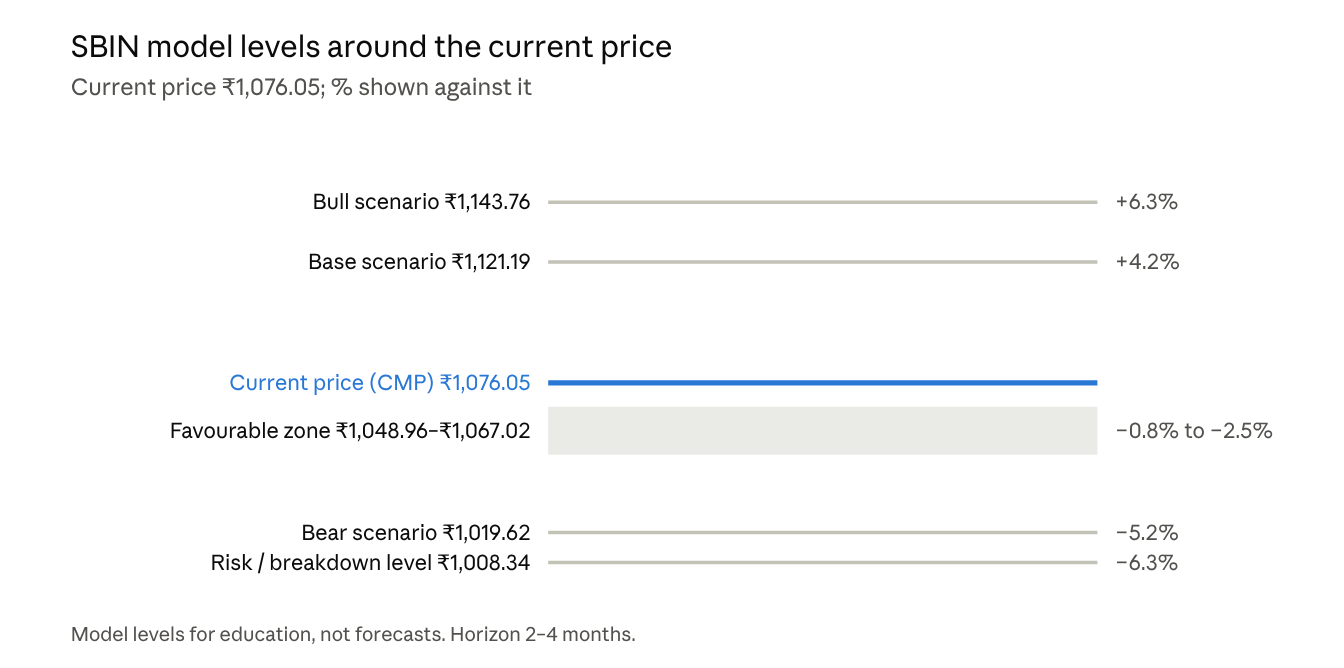
These are model levels for education, not forecasts:
| Level | Price | From CMP |
|---|---|---|
| Base scenario (resistance zone) | ₹1,121.19 | +4.20% |
| Bull scenario | ₹1,143.76 | +6.29% |
| Favourable zone | ₹1,048.96–₹1,067.02 | −0.84% to −2.52% |
| Bear scenario | ₹1,019.62 | −5.24% |
| Risk / breakdown level | ₹1,008.34 | −6.29% |
StockPrompt.ai analysis of SBIN, 12 Nov 2026 · model levels for education
The model’s horizon for these levels is 2–4 months. Risk-reward at the current price is 0.67x to the base level and 1.00x to the bull level. Near the favourable zone it rises to 1.27x and 1.73x.
Risks and what to watch
The main risk is a stretched price, but five other items matter for the next few quarters:
- Loan vs deposit growth: about 18% against about 10%. A widening gap could raise funding costs.
- Domestic NIM: whether it holds at or above 3% through FY27.
- Credit cost and slippages: currently 0.27% and 0.57% (Q1 FY27).
- Operating profit growth: it needs to catch up with PAT growth.
- Treasury and ECL transition: management flagged possible treasury losses and a net-of-tax ECL impact of ₹19,500 crore.
No material adverse legal or regulatory action surfaced in the model’s searches, though that is not an exhaustive legal check. To see how a private lender compares, read our HDFC Bank share price analysis and ICICI Bank share price analysis.
Conclusion: a strong franchise at an awkward moment on the chart
SBI’s fundamentals are the best they have looked in two decades on asset quality, with growth running ahead of guidance. The harder question is how much of that the SBI share price already reflects after a roughly 10% move in days. The model’s answer is moderately positive on the business and cautious on the near-term setup.
Checking both sides takes minutes when the data is in one place. You can run the same research on any NSE or BSE stock with StockPrompt.ai: see the features, compare plans, or sign up.
Try This on StockPrompt.ai
SBI Stock Analysis 2026: Can Credit Growth and Asset Quality Support Further Upside?
Frequently Asked Questions
Is the SBI share price expensive compared with PSU bank peers?
Yes, on P/E. SBIN trades at about 11.5x earnings against peers at 5.87x–9.63x, a median of about 7.2x. Its P/B is 1.45x on a book value of ₹727.56.
What is SBI’s gross NPA in Q2 FY27?
SBI’s gross NPA was 1.39% in Q2 FY27, the lowest in over 20 years. It was 1.47% in Q1 FY27 and 2.24% in March 2024.
What are the main risks in this SBI share price analysis?
A stretched price (RSI above 70, risk-reward of 0.67:1 at the current price) is the main one. Deposits growing about 10% against loans at about 18%, and profit growth that leans on lower provisions, are the others.
Disclaimer: This is AI-generated analysis for educational purposes only. AI can make mistakes, so please verify all data independently. It is not SEBI-registered investment advice. Please consult a SEBI-registered advisor before making investment decisions.
Sources: Company filings and press releases (Q1 and Q2 FY27), analyst-meet transcripts, brokerage previews, market news, publicly available peer financials and exchange price data, via StockPrompt.ai analysis, data as of 12 November 2026.