

Wipro’s shares have risen about 27% from their September low, and the P/E has moved from about 12x to about 15x. Yet constant-currency revenue grew just 0.6% year-on-year in Q2 FY27. This Wipro stock analysis 2026 uses StockPrompt.ai data as of 16 Nov 2026, 12:26 IST, with the share at ₹193.22. Verdict: a mildly bullish 65/100, because the turnaround shows in margins and EPS but not yet in revenue.
Recent results: EPS up, profit down
Wipro’s Q2 FY27 numbers, reported on 15 Oct 2026, flatter the underlying growth. Revenue rose 9.1% year-on-year in rupees, but IT services grew only 0.6% in constant currency and was flat quarter-on-quarter.
| Q2 FY27 metric | Reading |
|---|---|
| Revenue (rupees) | ₹24,753 Cr, +9.1% YoY |
| Net profit | About ₹3,200 Cr, down about 1.4–1.9% YoY |
| EPS | ₹3.23, +4.2% YoY |
| Consolidated operating margin | 19.6% (20.3% in Q4 FY26) |
| IT services operating margin | 16.5%, +0.5 points QoQ |
| Total bookings | $2,595M, down 22.9% QoQ |
| Profit fell because other income dropped 68% quarter-on-quarter after the ₹15,000 Cr buyback used up surplus cash. EPS still rose because the buyback reduced the share count. The 16.5% and 19.6% margins use different definitions: the first is the IT services segment, the second is consolidated. | |
 |
|
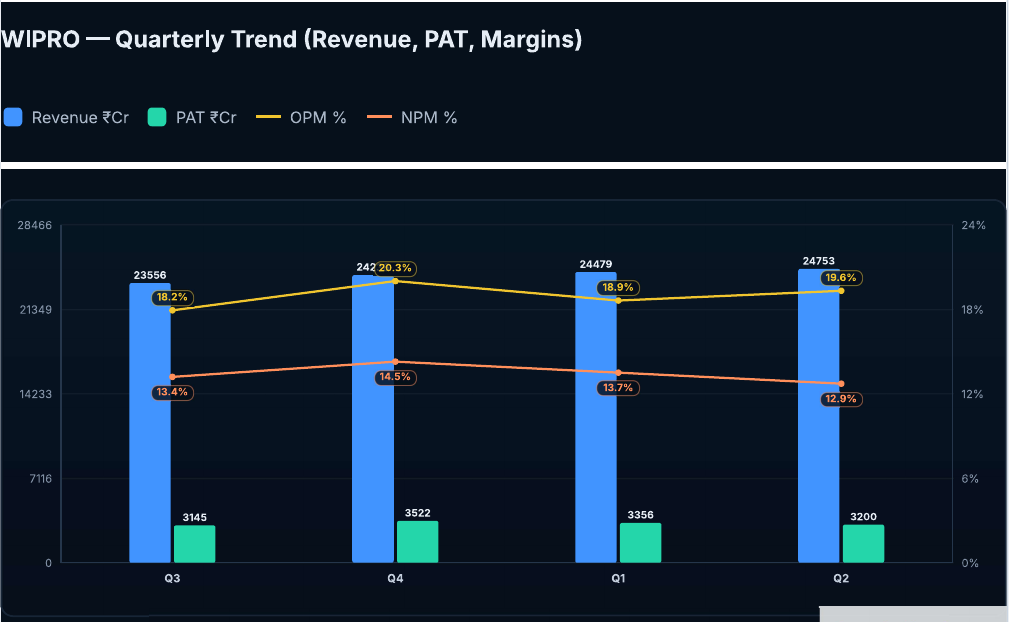
| Quarterly trend chart (from the StockPrompt.ai analysis). | |
| Revenue has risen for four straight quarters, from ₹23,556 Cr in Dec 2025 to ₹24,753 Cr in Sep 2026. Profit peaked in Mar 2026 at ₹3,522 Cr. For more on reading results, see our guide to quarterly results. |
Growth drivers: margins, deals and AI
Three things support the turnaround story: better margins, steadier staffing and AI-heavy deal wins. None has yet lifted revenue growth.
- Margins: IT services operating margin improved 0.5 points quarter-on-quarter to 16.5%.
- Attrition: voluntary attrition is 13.8% on a trailing 12-month basis, better than 17.1% in Mar 2026.
- Deal wins: Q2 wins were AI-heavy, including an AI Global Capability Center build and AI-led procurement and supply-chain platforms. FY26 large-deal TCV was $7.83B, the highest in the four-year series.
- Cash conversion: operating cash flow was 165.8% of net income in Q2, and the buyback was funded by three-year FCF/PAT of 122%. The sector backdrop is helping sentiment. The Nifty IT index rose 17% in October after falling 11% in September, and gained 12% in one week in November. It had fallen 36% from its July peak before the rebound. Wipro also has diversification, which gives some protection if one segment slows. BFSI is about 34% of revenue, Q2 consumer revenue grew 6% and tech/communications 7%, and platforms such as NetOxygen, Capco and Wipro Intelligence™ add domain depth.
The biggest weakness: growth that lags peers
Growth is the weak link. Constant-currency growth of 0.6% year-on-year is the slowest in the peer group, and three-year annual sales growth is only 0.8%. Near-term guidance is soft too. Q3 guidance is for IT services revenue of −1.5% to +0.5% quarter-on-quarter in constant currency, or $2,571M–$2,625M. Bookings fell 22.9% quarter-on-quarter because two confirmed deals slipped on paperwork, though management says both will sign in Q3. The cost base adds to the squeeze. Employee cost is 60% of revenue, against 57% at TCS and 52% at Infosys. Wipro’s $100M+ clients fell from 22 (Mar 2024) to 16 (Mar 2026), against 66 at TCS and 45 at Infosys, and the top five clients are 14.3% of revenue, up from 12.9% in Mar 2023.
Valuation versus peers
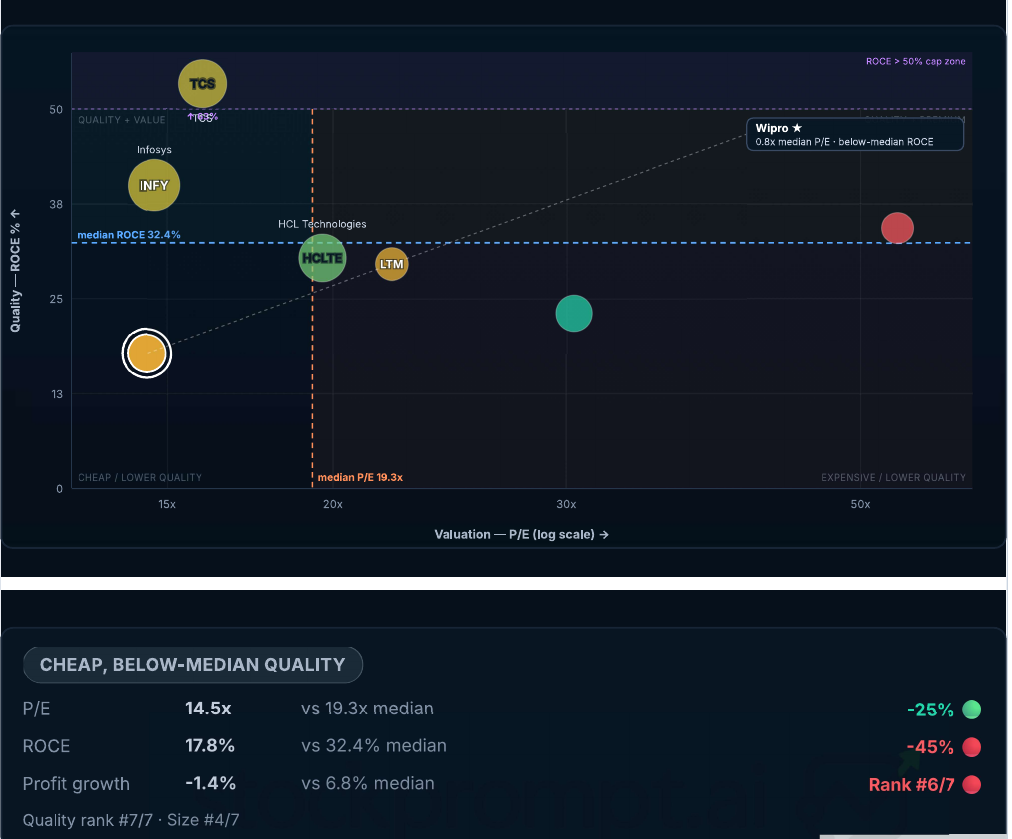
Wipro is cheap on P/E and offers the highest dividend yield, but it also has the lowest ROCE, so the discount partly reflects weaker quality. The model rates it “undervalued” at 14.96x trailing P/E on EPS of ₹12.92.
| Q2 FY27 | Wipro | TCS | Infosys | HCLTech | Tech M |
|---|---|---|---|---|---|
| Revenue YoY (₹) | 9.1% | 11.2% | 10.7% | 11.5% | 15.6% |
| Net profit YoY | −1.4% | 7.4% | 6.2% | 21.2% | 32.7% |
| Operating margin | 19.6% | 25.7% | 23.7% | 20.9% | 17.8% |
| ROCE | 17.8% | 63.0% | 40.0% | 30.4% | 23.1% |
| 3Y sales growth (annual) | 0.8% | 5.8% | 6.8% | 8.7% | 2.2% |
| P/E | 14.96x | 16.80x | 15.07x | 20.45x | 31.35x |
| Dividend yield | 5.65% | 2.66% | 4.2% | 3.92% | 2.89% |
| Wipro trades at an 11.0% P/E discount to TCS and 26.8% to HCLTech, and is level with Infosys. Its operating margin is 6.1 points below TCS and 4.1 points below Infosys, and its market cap is 22.1% of TCS’s. For the peers, see our TCS, Infosys and HCLTech analyses. | |||||
 |
|||||
| Peer positioning chart: valuation versus quality. | |||||
| A re-rating needs growth to catch up, because Wipro’s PEG is 2.87. As a sensitivity only, moving to the three-large-peer median P/E of 16.8x would imply about +12.3%, and the industry P/E of 19.43x about +29.9%. |
Technical view and model levels
The trend is constructive but short-term mixed. The share closed at ₹193.22 (−0.71%) on 16 Nov 2026 after an open of ₹195.21, a high of ₹197.83 and a low of ₹192.51, and sits about 27% below its 52-week high of ₹265.80.
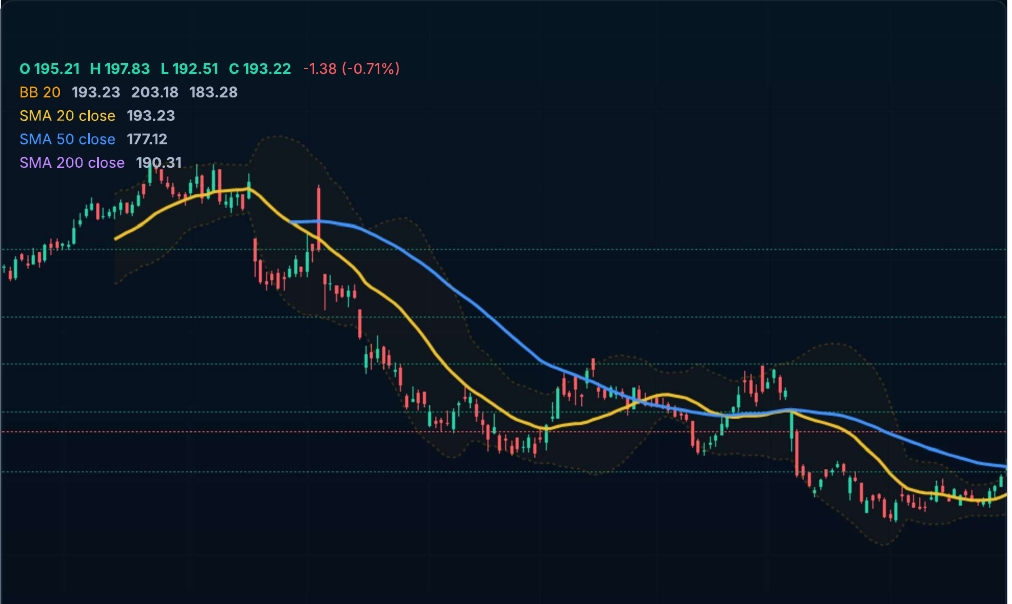 Price chart with moving averages and Bollinger Bands.
The price is above both the 50-DMA (about +9%) and the 200-DMA (about +1.5%). ADX is 40.3, which signals a strong trend, RSI is neutral at about 58–61 depending on the panel, and MACD is neutral. The price sits in the lower half of the Bollinger Band.
The model-computed levels below are for education only, over a horizon of about 63 trading days.
| Model level (education only) | Value |
|---|---|
| Favourable zone | ₹187.64–₹191.36 |
| Base upside level | ₹202.52 (+4.81%) |
| Bull upside level | ₹207.17 (+7.22%) |
| Risk level | ₹179.27 (−7.22%) |
| Bear scenario level | ₹181.59 |
| Reward-to-risk at current price | 0.67:1 base, 1.00:1 bull |
| Reward-to-risk near favourable zone | 1.27:1 base, 1.73:1 bull |
| At the current price the reward-to-risk ratio is unfavourable, and it improves only near the favourable zone. The model’s near-term score is 65/100 with a neutral bias. | |
| Read together, the signals favour patience rather than urgency. Trend and ownership are supportive, but the Wipro share price offers a thin reward-to-risk margin until it nears the favourable zone, which is the practical takeaway of this Wipro stock analysis 2026. |
Risks and what to watch
The main risk is that the turnaround slips into 2027. Deal slippage and a muted Q3 guide could delay it.
-
Sector demand: Infosys cut its FY27 constant-currency guidance to 1–2% from 1.5–3%, and discretionary spend has not recovered.
-
Re-rating already underway: with the stock up sharply from its low, some of the improvement may be priced in.
-
Policy: the analysis found news of new US immigration restrictions tied to the H-1B programme, but could not confirm the date or detail.
-
Lower other income: falling interest income after the buyback will weigh on net profit. Ownership is steady. Promoters hold 72.57% with no pledge, FIIs 9.46% (+0.61 pp), DIIs 5.14% (−0.08 pp) and the public 12.70% as of Sep 2026.
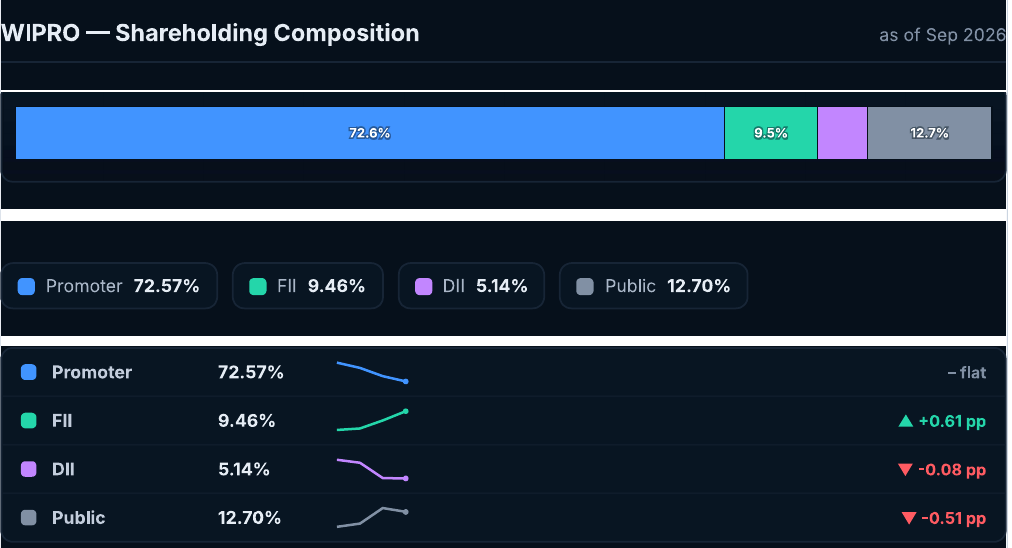 Shareholding composition, Sep 2026.
Key monitorables:
-
Q3 constant-currency revenue against the −1.5% to +0.5% guidance, and whether growth turns positive in Q4.
-
Signing of the two slipped large deals, and bookings conversion.
-
IT services margin and the $100M+ client count (16), plus top-five concentration (14.3%).
-
Sequential growth against peers: Wipro’s 1.1% compares with 1.3–3% at peers. Management says next results come in January; the exact date is unconfirmed.
Conclusion
Wipro is a turnaround that still has to be proven in the top line, and this Wipro stock analysis 2026 shows why the market is paying more before the growth arrives. The balance sheet, cash flow and dividend yield look solid, but growth, ROCE and the cost base still trail the large peers. The next test is Q3, when the two delayed deals should sign. To follow it, read the quarterly results and run your own checks with StockPrompt.ai’s research features. You can see pricing or sign up to try it on any NSE or BSE stock.
Try this on StockPrompt.ai
Paste this prompt into StockPrompt.ai to generate your own report:
“Wipro Stock Analysis 2026: Can Its Business Turnaround Close the Gap With IT Peers?”
Frequently Asked Questions
Is Wipro cheap compared with TCS and Infosys?
On P/E, yes. Wipro trades at 14.96x, an 11.0% discount to TCS (16.80x) and level with Infosys (15.07x), and it has a 5.65% dividend yield. Its ROCE of 17.8% is the lowest in the group.
Why did Wipro’s profit fall while EPS rose?
Other income dropped 68% quarter-on-quarter after the ₹15,000 Cr buyback used up surplus cash, which pulled net profit down. The buyback also reduced the share count, so EPS still rose 4.2% year-on-year to ₹3.23.
What are the model levels for Wipro?
For education only, the favourable zone is ₹187.64–₹191.36, the risk level is ₹179.27, and the base and bull upside levels are ₹202.52 and ₹207.17 over about 63 trading days.
Disclaimer: This is AI-generated analysis for educational purposes only. AI can make mistakes, so verify all data independently. It is not SEBI-registered investment advice. Consult a SEBI-registered advisor before making investment decisions.
Sources: Company filings and Q2 FY27 earnings call, exchange data, company financials and peer comparison data, financial media reports, and StockPrompt.ai model analytics (data as of 16 Nov 2026, 12:26 IST).